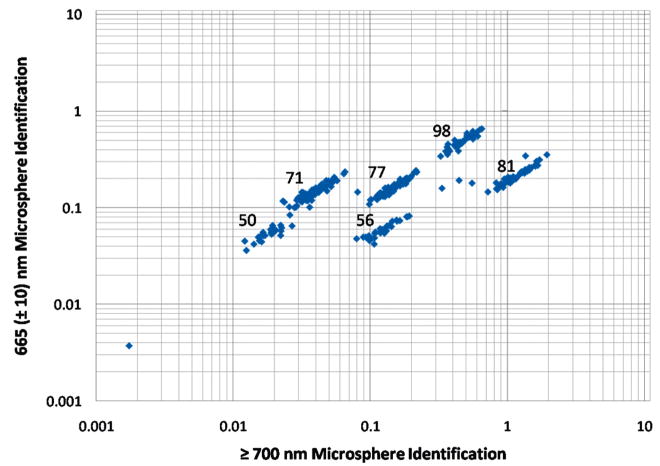
Figure 3.
A log–log plot of relative fluorescence emission intensities at 670 ± 10 nm and ≥700 nm, normalized to light scatter intensities at 635 ± 5 nm, to identify coded microspheres containing variable amounts of two fluorescent dyes. The emission is a result of excitation by a 635 nm wavelength laser. The numbers associated with each population represent the microsphere code (as designated by the manufacturer).

