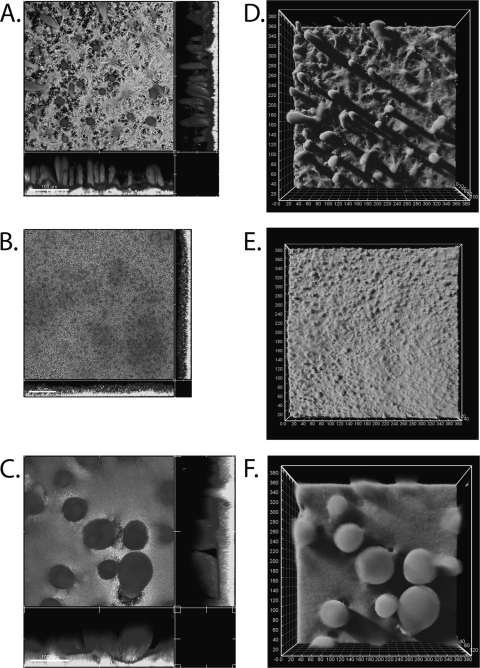
FIG. 2.
P. aeruginosa biofilm formation in a continuous-culture flow cell 4 days postinoculation as analyzed using a confocal laser scanning microscope. (A and D) P. aeruginosa PDO300(pBBR1MCS-5); (B and E) P. aeruginosa PDO300Δalg8(pBBR1MCS-5); (C and F) P. aeruginosa PDO300Δalg8(pBBR1MCS-5:alg8). Panels A, B, and C are sectional views; panels D, E, and F are three-dimensional projections. Images are representative of results from three independent experiments. The magnification is ×400.

