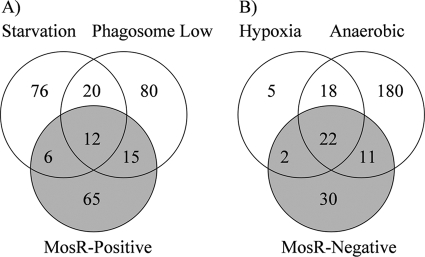
FIG. 3.
Comparative analysis of the transcriptome of M. tuberculosis exposed to various conditions. (A) Venn diagram representing the number of positively mosR-regulated genes compared to genes induced under nutrient starvation (3) and those repressed in the phagosome environment (36). (B) Venn diagram representing the number of negatively mosR-regulated genes compared to genes induced under hypoxia (27) and anaerobic conditions (25).

