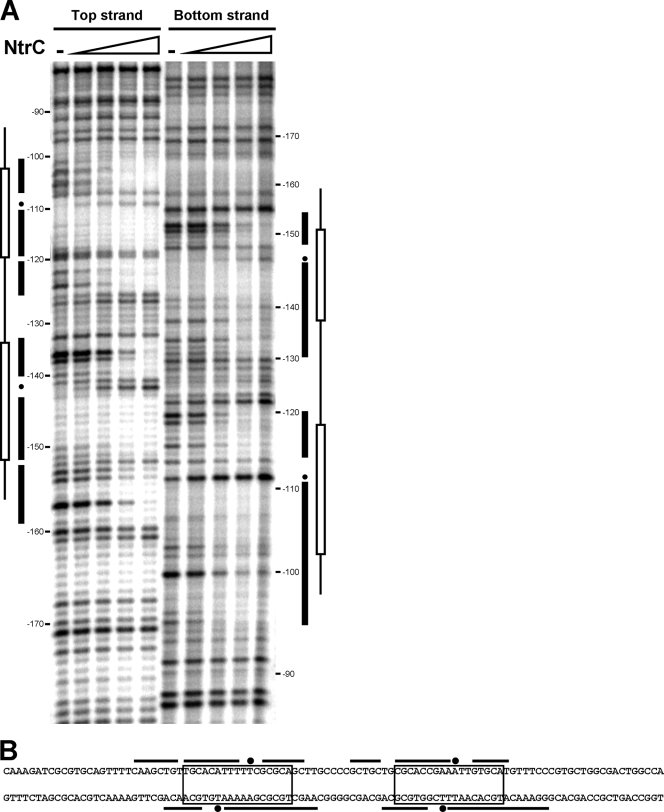
FIG. 3.
NtrC DNase I footprint of the glnK promoter region. (A) Top- and bottom-strand footprint patterns. Predicted NtrC binding sites (open boxes), protected regions (black bars), and hypersensitive positions (dots) are marked. NtrC(D55E,S161F) concentrations were 0, 50, 100, 200, and 500 nM for each strand. The coordinates are relative to the glnK transcriptional start site. (B) Schematic representation of the protected regions on the sequence of the glnK promoter, with the same indications as for the footprint pattern.

