FIG. 4.
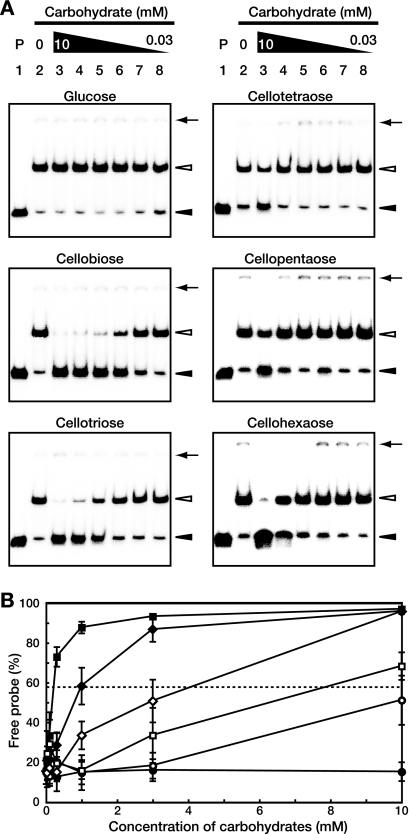
Inhibition of the DNA-binding activity of CebR by cellooligosaccharides. (A) EMSAs using CebR-H and a DNA fragment containing the cebE promoter region in the presence of the indicated carbohydrates. Lane 1, a negative control without CebR-H; lanes 2 to 8, CebR-H homodimer (at 15 nM, so that approximately 85% of the probe is shifted in the absence of carbohydrates) with carbohydrate at 0 mM (lane 2; control), 10 mM (lane 3), 3 mM (lane 4), 1 mM (lane 5), 0.3 mM (lane 6), 0.1 mM (lane 7), and 0.03 mM (lane 8). The positions of free probes (solid arrowheads), DNA-CebR-H complexes (open arrowheads), and the wells (solid arrows) are shown. (B) Plot of percentages of free probe versus concentrations of each carbohydrate: glucose (•), cellobiose (▪), cellotriose (♦), cellotetraose (○), cellopentaose (□), and cellohexaose (⋄). The values shown are averages and standard deviations from triplicate assays. A dashed line indicates 50% dissociation of the protein-DNA complex for calculation of the apparent Kd value for each cellooligosaccharide.

