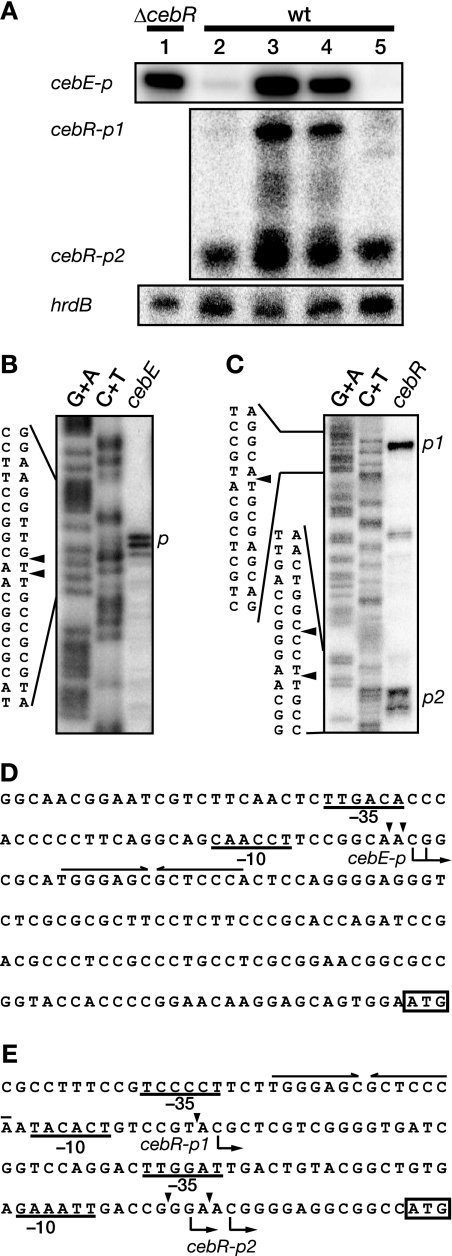
FIG. 5.
Transcriptional analysis of cebE and cebR. (A) Transcription of cebE and cebR in S. griseus was examined by low-resolution S1 nuclease mapping. Total RNA was prepared from the ΔcebR mutant (lane 1) or the wild-type strain (lanes 2 to 5) grown in liquid SMM containing 1% glucose (lanes 1 and 2), 1% cellobiose (lane 3), 1% glucose plus 1% cellobiose (lane 4), and 1% glycerol (lane 5) at 30°C for 50 h. (B and C) High-resolution S1 nuclease mapping of cebE (B) and cebR (C). S1-protected fragments were analyzed in parallel with the sequence ladders (lanes G+A and C+T) (24). The arrowheads indicate the positions of S1 nuclease-protected fragments. The 5′ terminus of the mRNA was assigned to the positions shown in panels D and E because fragments generated by the chemical sequencing reactions migrated 1.5 nucleotides further than the corresponding fragments generated by S1 nuclease digestion of the DNA/RNA hybrids (one-half residue from the presence of the 3′-terminal phosphate group and one residue from the elimination of the 3′-terminal nucleo tide). (D and E) Nucleotide sequences of the upstream regions of cebE (D) and cebR (E). Transcriptional start points are shown by arrows below the sequences. The probable −35 and −10 sequences are underlined. A CebR box is indicated with a pair of convergent arrows above the sequence. Probable translational start codons are boxed.

