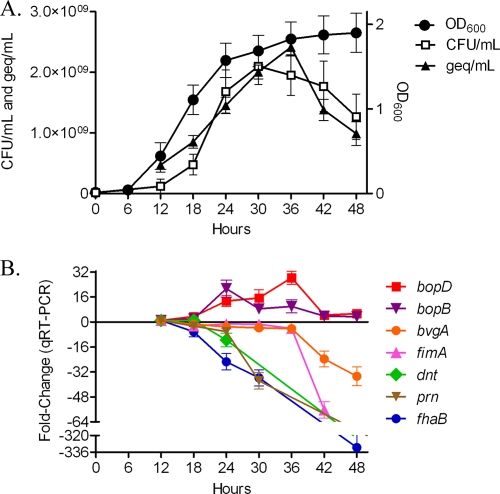
FIG. 1.
Growth curves and changes in virulence gene expression of B. bronchiseptica strain RB50. (A) DNA concentrations (geq/ml) and CFU counts (CFU/ml) during growth of RB50 are plotted along the left y axis; optical densities (OD600) are plotted along the right y axis; and time, given in hours, is plotted along the x axis. All data points represent averages obtained from triplicate cultures. (B) Change in gene expression (y axis) occurring at 6-h intervals (x axis), starting at early log phase (12 h) and continuing until late stationary phase (48 h), determined by using qRT-PCR. Data shown are averages obtained from triplicate cultures. The error bars represent standard deviations.

