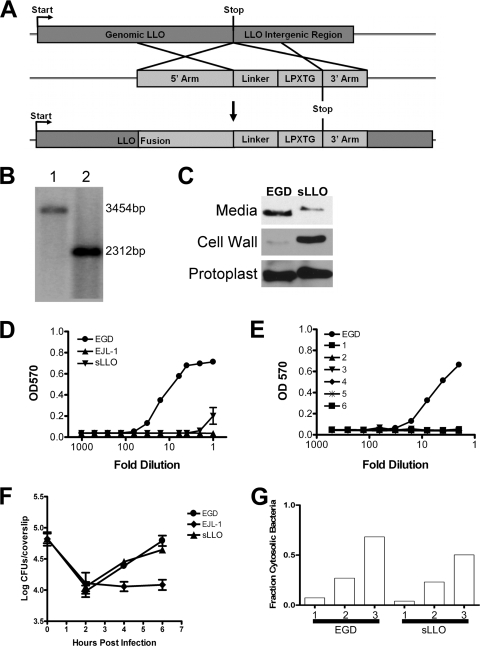
FIG. 1.
Genotype and in vitro phenotype of the sLLO mutant of L. monocytogenes. (A) Genomic construct of LLO bearing a hexahistidine linker and the LPXTG cell wall targeting motif of internalin A. (B) Southern analysis of the wild-type (1) and sLLO (2) strains on BamHI-digested genomic DNA with a probe directed against LLO. The wild-type sequence migrated at 3,454 bp, and the mutant variant migrated at 2,312 bp. (C) Immunoblot analysis of bacterially associated LLO. Mid-log culture supernatants (media), cell wall fraction (cell wall), or protoplasts were isolated as described in Materials and Methods. LLO was detected by immunoblotting with an LLO-specific monoclonal antibody (A4-8). (D) Culture supernatants of the mid-log-cultured sLLO, EJL-1, and EGD strains were tested for hemolytic activity on human RBC. (E) Mice were infected with 106 EGD or sLLO strain cells, and spleens were homogenized and plated on BHI. Single colonies were picked and grown overnight in standing BHI culture at 37°C. Numbers 1 to 6 in panel E represent individual colonies of the sLLO strain. Supernatants were serially diluted, and hemolytic activity was determined by RBC lysis assay. (F) PEC were infected with equivalent doses of the EGD, EJL-1, or sLLO strain, and at the indicated times, cells were lysed and total bacterial number was determined by titration on BHI agar plates. Points represent the mean ± standard error for triplicate wells. (G) PEC (2.5 × 10⁵) were infected with equivalent numbers of EGD or sLLO strain cells (MOI of 1), and at the indicated times (hours), the cells were fixed and stained for L. monocytogenes and phalloidin. The percentage of cytosolic bacteria was determined by counting phalloidin-positive L. monocytogenes cells and dividing it by the total number of bacteria. Each bar represents the percentage determined from counting four to six microscopic fields from two independent experiments. The total number of bacteria counted was between 350 and 800 per bar. There was no statistical difference between the EGD and sLLO groups (Mann-Whitney U test).

