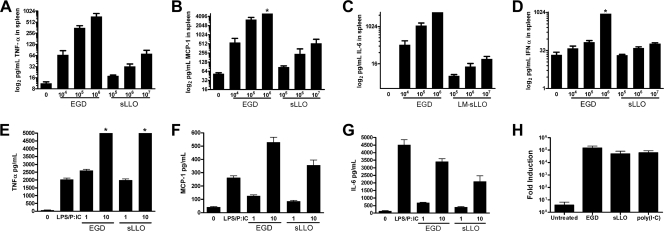
FIG. 3.
Inflammatory cytokine responses and T-cell responses following infection with the sLLO or EGD strain. (A to D) Mice were either uninfected or infected with the indicated doses of the EGD or sLLO strain for 3 days. Spleens were isolated from mice and tested by cytometric bead array for TNF-α (A), MCP-1 (B), IL-6 (C), or IFN-α (D). (E to G) C.B-17 PEC were left untreated (0), infected with an MOI of 1 or 10 of either the sLLO or EGD strain for 24 h, or treated with 10 ng/ml lipopolysaccharide and 100 ng/ml poly(I · C), and then culture supernatants were assayed for either TNF-α (E), MCP-1 (F), or IL-6 (G) content by CBA. Bars represent the mean ± standard error for either four to six mice or three culture supernatants per group. Asterisks indicate assays in which the maximal limit of detection was reached. The Mann-Whitney U test did not find a statistical difference between any of the MOI 1 or 10 cytokine responses between the EGD and sLLO strains. (H) A total of 106 C.B-17 PEC were infected with the EGD or sLLO strain at an MOI of 10 or 100 ng/ml poly(I·C), and after 6 h, total RNA was isolated, treated with DNase I, and reverse transcribed, and qRT-PCR was performed using SYBR green with an internal fluorescein loading control (iCycler, IQ master mix; Bio-Rad). Induction (fold) of IFN-β mRNA was determined by ΔΔCt calculation with HPRT as the housekeeping control. Bars represent the mean of independent samples assayed in duplicate.

