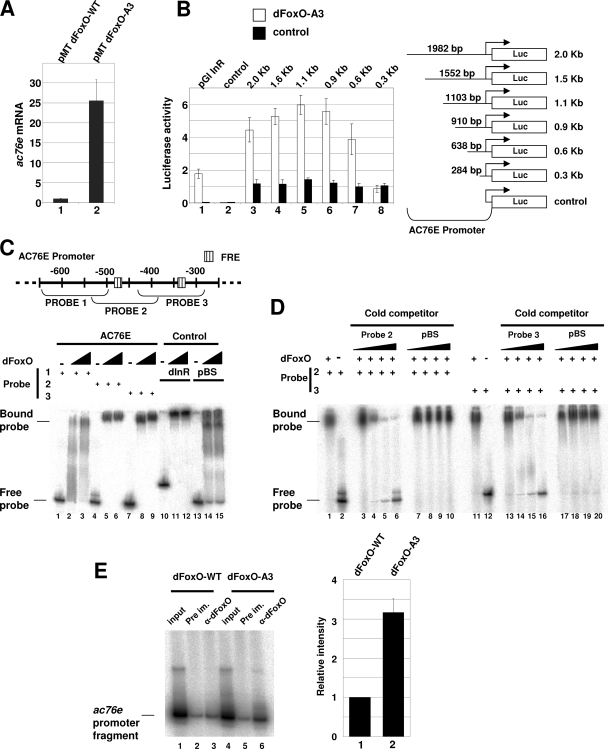
FIG. 1.
dFoxO directly activates transcription of ac76e. (A) qPCR assay showed a 25-fold increase in ac76e mRNA upon dFoxO-A3 overexpression (bar 2) compared to the dFoxO-WT control level (bar 1) in S2 cells. (B) Luciferase assays showed activation of different ac76e promoter fragments upon cotransfection with dFoxO-A3 compared to results for the empty vector control. Bars in lane 1, positive control with dinr promoter; bars in 2, negative control with empty pGl vector. Bars in lanes 3 to 8, dFoxO-A3 cotransfections with different ac76e promoter fragments. (C) Schematic representation of the ac76e promoter showing the putative FREs (striped boxes) in the region from −300 to −600 bp upstream of the transcription start site. The probes used in band shift experiments (below) are indicated. Recombinant dFoxO binds to probes 2 (lanes 4 to 6) and 3 (lanes 7 to 9). Lanes 10 to 12 show the positive control dinr promoter. Lanes 13 to 15 show the negative control pBS. (D) The specificity of the binding to these promoter regions was confirmed by competition experiments. Cold competitors for probes 2 (lanes 1 to 6) and 3 (lanes 11 to 16) reversed the band shift, whereas the negative control, pBS, did not (lanes 7 to 10 for probe 2 and lanes 17 to 20 for probe 3). (E) dFoxO binds specifically to ac76e promoter in vivo. ChIP of cross-linked extracts of S2 cells expressing dFoxO-WT (lanes 1 to 3) or dFoxO-A3 (lanes 4 to 6) grown in the presence of insulin. Relative intensities of lanes 3 and 6 as quantified with a phosphorimager (bars 1 and 2, respectively) are shown. The error bars represent standard deviations from three independent measurements. DNA fragments were detected by incorporating [P32]dCTP in the PCR mix.

