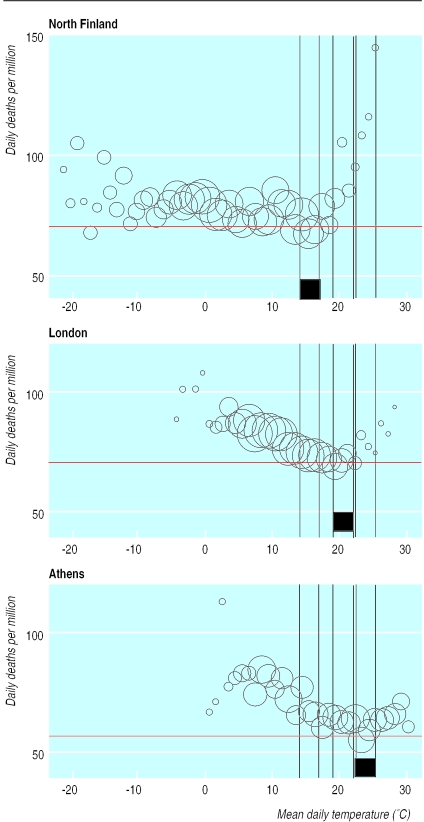
Figure.
Daily mortality of people aged 65-74 in relation to mean daily temperatures in regions with the coldest, median, and warmest summer temperatures (May to August). The black squares indicate the 3°C band of minimum mortality for the region (calculated at 0.1°C intervals) and the horizontal lines show mortality in this band

