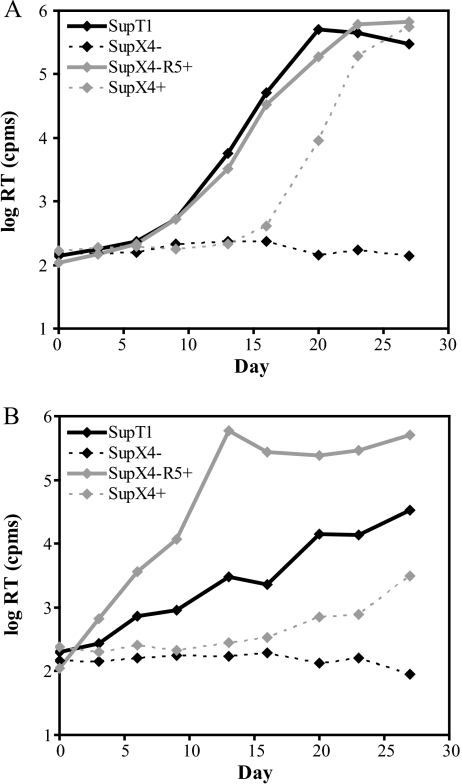
FIG. 3.
Use of CXCR4− SupT1 cells to assess CXCR4 use. Growth curves are shown for 239-ST1.2-32 Long CT (A) and SIVmac239 (B) in parental SupT1 cells, CD4+ CXCR4− CCR5− SupX4− cells, CD4+ CXCR4− CCR5+ SupX4−R5+ cells, and SupX4− cells that were complemented with stable CXCR4 expression (SupX4+ cells). RT activity in culture supernatants was measured at the indicated time points. Results from a representative experiment are shown for each panel.

