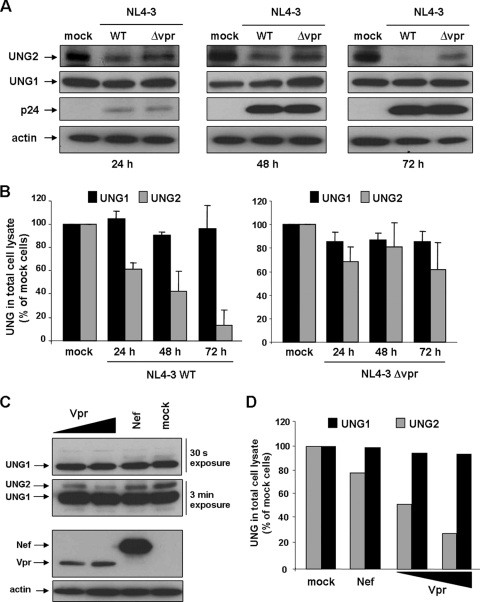
FIG. 1.
Downregulation of the UNG2 protein in HIV-1-infected cells and in Vpr-expressing cells. (A) Immunoblot analysis of UNG proteins in HIV-1-infected cells. HeLa-CD4 cells were infected with VSVG-pseudotyped wild type or ΔVpr HIV-1NL43, and protein extracts were analyzed before (mock) or after infection (24, 48, and 72 h) by WB using anti-UNG1 and -UNG2 polyclonal antibody PU59 (upper panels), anti-p24 (middle panels), and anti-actin antibodies (lower panels). (B) The intensity of UNG2 and UNG1 bands was quantified by densitometry using NIH Images software from the panels shown in panel A. UNG1 and UNG2 levels were normalized to those of actin. The values represent the percentage of the UNG2 (░⃞) and UNG1 (▪) signal intensity in wild type (left part)- or Δvpr (right part)-infected cells relative to mock cells (100%) and correspond to the mean of three independent experiments. (C) Immunoblot analysis of UNG proteins in Vpr-expressing cells. HeLa cells were transfected with vectors for expression of HA-tagged forms of Vpr (0.5 or 1 μg of plasmid) or Nef (0.25 μg); mock, control cells transfected with the empty plasmid (1 μg). At 24 h after transfection, protein extracts (50 μg) were analyzed by WB using anti-UNG (PU59, upper panels), anti-HA (middle panel), and anti-actin (lower panel) antibodies. The immunoblot for analysis of UNG1 and UNG2 expression was exposed for 30 s (upper panel) or 3 min (lower panel). (D) The intensity of UNG2 and UNG1 bands was quantified by densitometry using NIH Images software from the panels shown in panel C. UNG1 and UNG2 levels were normalized to those of actin. The values represent the percentage of the UNG2 (░⃞) and UNG1 (▪) signal intensity in Nef- and Vpr-expressing cells relative to mock-transfected cells (100%) and are representative of three independent experiments. WT, wild type.

