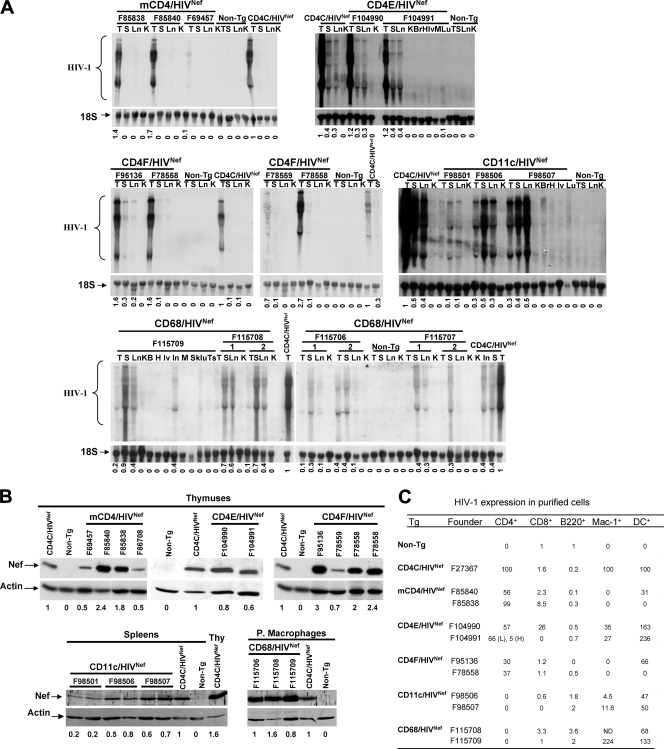
FIG. 2.
Expression of HIV in Tg mice. (A) Northern blot analysis of HIV-1 RNA from various tissues of Tg mice of the indicated founder (F) lines and from non-Tg littermates. RNAs from CD4C/HIVNef Tg mice (F27367) serve as a positive control. Total RNAs were hybridized with 32P-labeled HIV-1-specific probes. The blots were striped and rehybridized with a 32P-labeled DNA oligonucleotide probe homologous to 18S rRNA. Also shown below each blot are the semiquantitative values for the levels of expression relative to CD4C/HIV Tg tissues (value of 1), measured as described in Materials and Methods. Symbols: T, thymus; S, spleen; Ln, lymph nodes; K, kidney; Br, brain; Lv, liver; Lu, lungs; H, heart; Sk, skin, Ts, testis; M, muscle. (B) Western blot analysis of Nef in protein extracts from different tissues. For mCD4/HIVNef, CD4E/HIVNef and CD4FNef Tg mice, thymuses from 1-month-old mice and from their non-Tg littermates were used. A thymus from CD4C/HIVNef Tg mouse was used as a positive control. For CD68/HIVNef and CD11c/HIVNef Tg mice, proteins were detected in peritoneal macrophages and spleen, respectively. The membranes were probed with rabbit anti-Nef antibodies and then stripped and blotted with anti-actin antibody. Proteins were visualized by incubating the membranes with secondary anti-rabbit antibodies coupled to Alexa 680 fluorochrome, followed by scanning with an Odyssey infrared imaging system (Licor). The actin-specific bands were visualized on the same imaging system as described above for the Nef-specific bands. The ratio of the Nef-specific signal relative to that of actin was obtained. The numbers below each lane represent the semiquantitative values for the levels of expression relative to CD4C/HIVNef Tg cells (value of 1), measured as described in Materials and Methods. (C) Quantitative RT-PCR analysis. The indicated cell populations were purified by cell sorting or by plating (for peritoneal macrophages) from the LN, spleens, and peritoneal cavities of the different founder strains, as described in Materials and Methods. Staining was performed with PE-coupled anti-mouse B220 (B cells), with APC-coupled anti-mouse CD4 (CD4+ T cells), with FITC-coupled anti-mouse CD8 (CD8+ T cells) or with FITC-coupled anti-mouse CD11c + PE-coupled anti-mouse CD11b (CD11c+CD11bHigh myeloid DC). Cells were sorted by gating on the PE-, APC-, FITC-, or PE+FITC-positive population. Total RNA was extracted from these cells and quantitative real-time RT-PCR was carried out to detect the HIV-1 transgene RNA, as described in Materials and Methods. The relative levels of expression are shown, with arbitrary values of 100 or 1. All values for the CD4+ cells, macrophages, or DC of each founder line of each strain are expressed relative to 100 of CD4C/HIVNef Tg CD4+ T cells, macrophages, or DC, respectively. All values for CD8+ T cells and B220+ B cells of each founder line of each strain are expressed relative to the value 1 of non-Tg CD8+ T cells or B220+ cells, respectively. Therefore, for each cell subset, a comparison was made between the different strains. In F104991 CD4E/HIVNef Tg mice, CD4+ T cells expressing high (H) or low (L) CD4 were analyzed. ND, not done.

