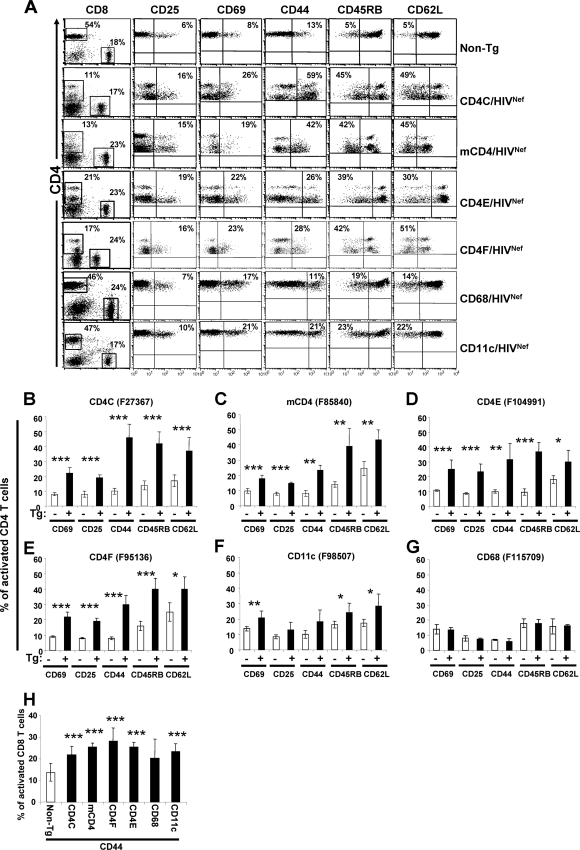
FIG. 4.
Immunophenotype of activation markers on pLN CD4+ and CD8+ T cells from Tg mice. (A) Three-color FACS analysis (CD4-APC, CD8-FITC, and CD25-, CD44-, CD45RB-, CD62L-, or CD69-PE) of CD4+ T cells was performed on pLN from a representative Tg mouse from each strain expressing HIV at high levels, as well as from control CD4C/HIVNef Tg mouse and a non-Tg littermate, as described in the legend to Fig. 3. Isotype control antibody for each activation marker was used as a negative control. The number in the upper quadrant represents the percentage of cells in this quadrant. (B to G) Quantification of the percentages (mean ± the standard error of the mean [SEM]) of CD4+ T cells expressing CD25, CD69 and CD44 cell surface markers, or being negative for CD45RB and CD62L, as analyzed and shown in panel A. The data were pooled from five to seven non-Tg mice and six to eight Tg mice (3 to 7 months old) from each Tg mouse founder line as described for Fig. 3A. Statistical analyses were performed by using the Student t test by comparing the Tg CD4+ T cells with non-Tg CD4+ T cells expressing the indicated cell surface markers. *, P < 0.05; **, P < 0.01; ***, P < 0.001. (H) Histograms representing the percentages (mean ± the SEM) of CD8+ T cells expressing CD44 in different Tg strains. These were obtained and analyzed as described in panels B to G.

