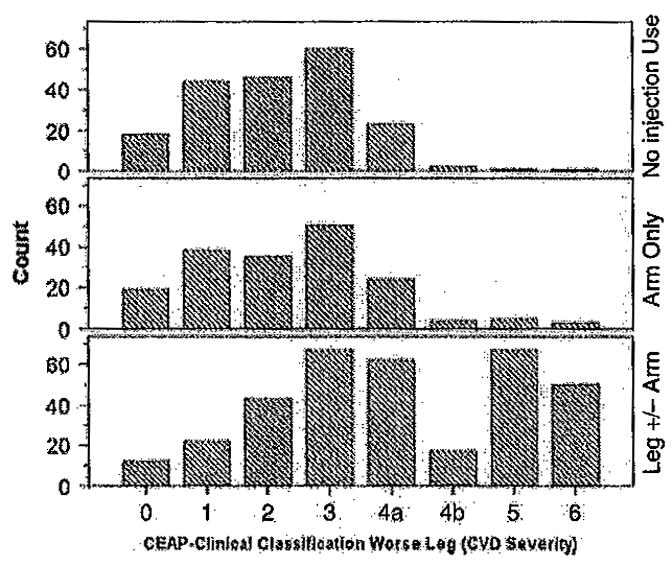
Figure 2.

Distribution of clinical CEAP score of the worse leg by site of injection/noninjection drug use. The distribution of clinical CEAP scores and site of injection/noninjection group was significant [χ2(14, N = 713) = 168.5, p < 0.001]. The distributions did not differ between the no injection and arm-only injection groups [χ2(7, N = 373) = 6.46, p = 0.49].
