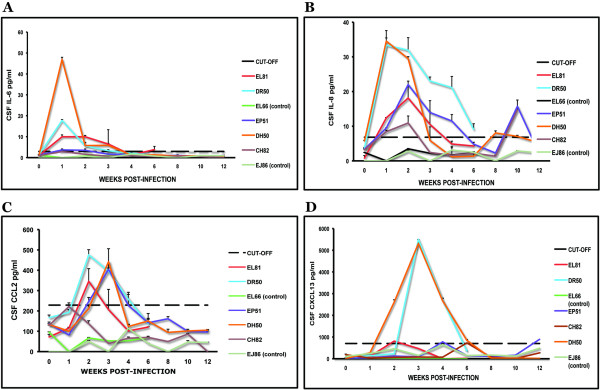
Figure 2.
Early appearance of cytokines and chemokines in the CSF. Levels of IL-6 (A), IL-8 (B), CCL2 (C) and CXCL13 (D) in the CSF of all of the animals in the study as a function of time PI. The dotted line represents the cut-off value obtained as described in Materials and Methods. Data represent the mean ± SD of duplicate determinations except for CXCL13, where availability of CSF only permitted duplicate determinations for all data points of animal DH50, and some data points of animals DR50 and CH82.

