Figure 6.
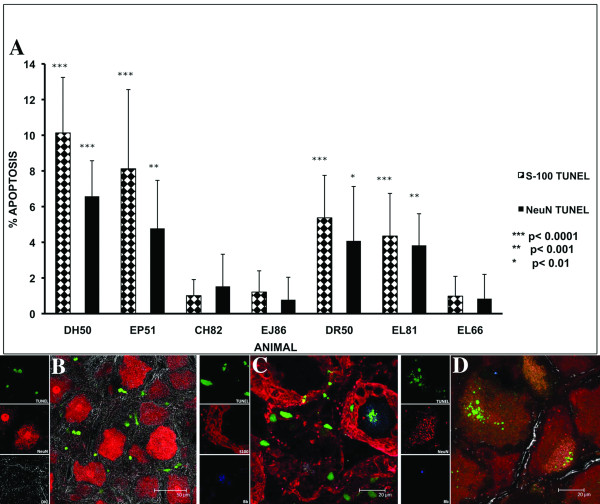
Schwann cell and/or Satellite cell and neuronal apoptosis in DRG. A) Percentage of Schwann/satellite cells and neurons dying by apoptosis as revealed by the in situ TUNEL assay performed on tissues from the DRG of all of the animals in the study. Data represent the mean values ± SD of the counts from ten fields. The p values represent the statistical significance with respect to the control animal (EL66 wk 6 and EJ86 wk 12) for each group. B) A qualitative view of the extent of the apoptosis (green) around neurons stained with antibody to NeuN followed by secondary antibody conjugated to Alexa fluor 568 (red) observed in the DRG of DH50 following the in situ TUNEL assay and immunofluorescence staining and confocal microscopy. C) Apoptosis of DRG Schwann/satellite cells. DRG sections from animal DH50 were labeled with antibody to S-100, followed by secondary antibody conjugated to Alexa fluor 568 (red). Cells undergoing apoptosis, stained using the TUNEL assay, are shown in green (FITC). Apoptotic Schwann/satellite cells surround a neuron that appears unstained as it does not take up the S-100 antibody, but is also showing the TUNEL signal in the center. D) Neurons stained with anti-NeuN antibody (red), and undergoing apoptosis (green) are shown in the vicinity of residual B. burgdorferi antigen (blue). The confocal micrograph is from a DRG section of animal DH50, following application of the in situ TUNEL assay and immunofluorescence staining. B. burgdorferi antigen is seen as blue due to labeling with anti-whole-cell B. burgdorferi antigen followed by secondary antibody conjugated to Alexa 633.

