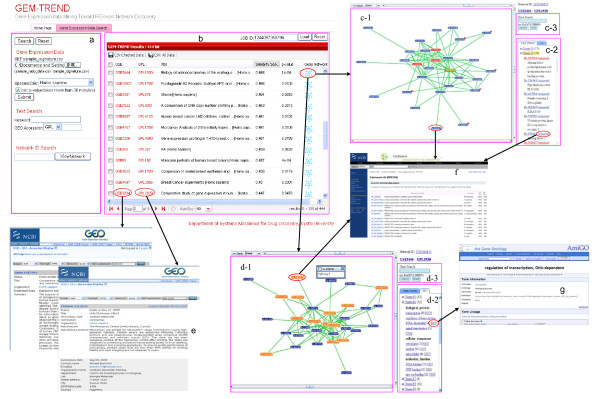
Figure 3.
Screenshot of GEM-TREND. a) Query input area. The gene-expression signature, gene expression ratio data and text are accepted. Network IDs can be used to retrieve previous networks. b) Results area. The search results of GEO series ID (GSE ID), GEO platform ID (GPL ID), series title, similarity score, and p-value are displayed. One record corresponds to one GEO series and links to GEO by GSE ID and GPL ID. The previous results can be retrieved by JOB IDs. c) Network visualization (Gene Cluster tab): c-1) Network graphical display area. Genes (nodes) in red background are genes from query, while the genes in the yellow background are those that are user-selected. The number shown in the top-right of the genes describes the number of hidden linkages. These linkages can be expanded or hidden by a right click on the gene of interest to choose from the pop-up menu. Genes link to the UniGene database by double clicking. c-2) Gene cluster area, whereupon gene clusters are shown. The number following the cluster describes the number of member genes in the cluster. Genes link to the UniGene database by clicking the UniGene icon. c-3) Gene search window. Matched genes will be highlighted in the gene cluster area. d) Network visualization (GO tab): d-1) Network graphical display area. Genes in the orange background are those associated with the common GO term. d-2) Gene annotation. The top three significant shared GO terms of genes in each ontology are shown for each cluster. The number following the term describes the number of genes associated with the term. Terms link to GO by clicking the GO icon. d-3) Gene search window. e) Linkout to GEO database. f) Linkout to Unigene database. g) Linkout to Gene Ontology database.

