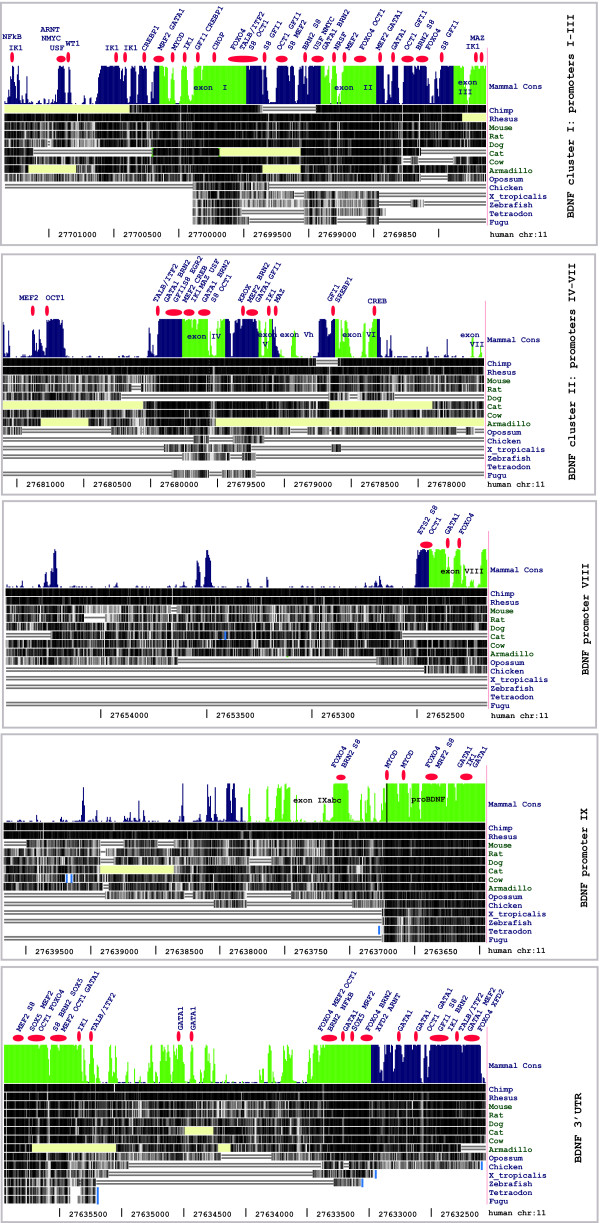
Figure 3.
Novel regulatory elements in the BDNF gene. Highly conserved TFBSs in the BDNF locus as predicted by DiRE and CONFAC tools. Given TFBSs were also found to be over-represented in the BDNF-correlated genes. Histograms represent evolutionary conservation across 9 mammal species (adapted from UCSC Genome Browser at http://genome.ucsc.edu/) (39). The height of the histogram reflects the size of the conservation score. Conservation for each species is shown in grayscale using darker values to indicate higher levels of overall conservation. Missing sequences are highlighted by regions of yellow. Single line: no bases in the aligned species; double line: aligning species has one or more unalignable bases in the gap region. Transcribed regions (BDNF exons and 3'UTR) are highlighted in green; non-transcribed regions (BDNF promoters and introns) are highlighted in blue. Red ovals represent TFBSs mapped to the BDNF gene sequences. Mapped TFBSs have Matrix Similarity score >0.85 and Core Similarity score >0.99. Core elements of presented TFBSs have 100% of conservation across mammals. For the structure of human BDNF see Pruunsild et al., 2007 [11].

