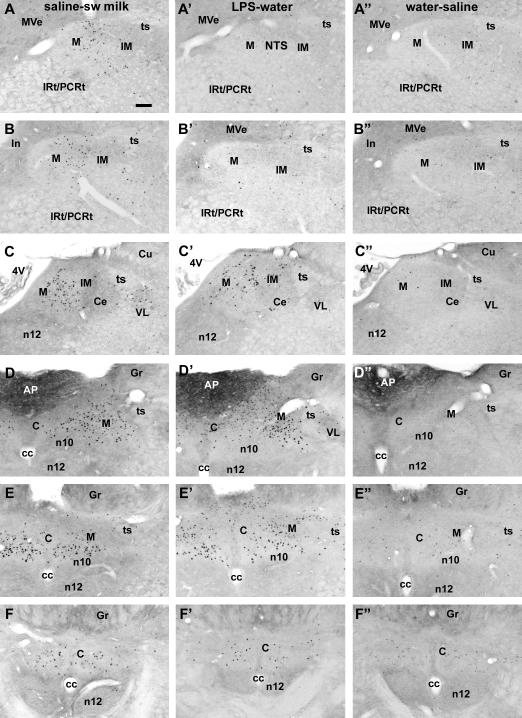
Fig. 1.
Series of photomicrographs showing the rostrocaudal distribution (from top to bottom with the rostral-most image at the top) of c-Fos staining in the NTS following saline injection and sweetened milk consumption (left column A-F), after LPS injection (0.1 mg/kg i.p.) and offered water (middle column A’-F’), and following saline injection and water offer (right column, A”-F”). Milk consumption (ad libitum) induced large numbers of c-Fos-labeled cells in the rostral-most NTS ventral to the medial vestibular nucleus (A,B), in which region LPS injection resulted in few c-Fos cells (A’,B’). At mid- and caudal levels where the NTS borders the fourth ventricle, the area postrema and the gracile nucleus, both stimuli gave rise to comparable levels of c-Fos expression (C-F and C’-F’), but the distribution patterns within these parts of the NTS are not identical. Small numbers of c-Fos-labeled cells were present following saline injection and presentation of water (A”-F”). Scale bar in A = 100 μm. Abbreviations: 4V, fourth ventricle; C, commissural subnucelus (NTS); Ce, central subnucleus (NTS); cc, central canal; Gr, gracile nucleus; IM, intermediate subnucleus (NTS); IRt/PCRt, intermediate/parvicellular reticular nucleus; M, medial subnucleus (NTS); n10, motor nucleus of the vagus; n12, hypoglossal nucleus; ts, tractus solitarius; VL, ventrolateral subnucleus (NTS).

