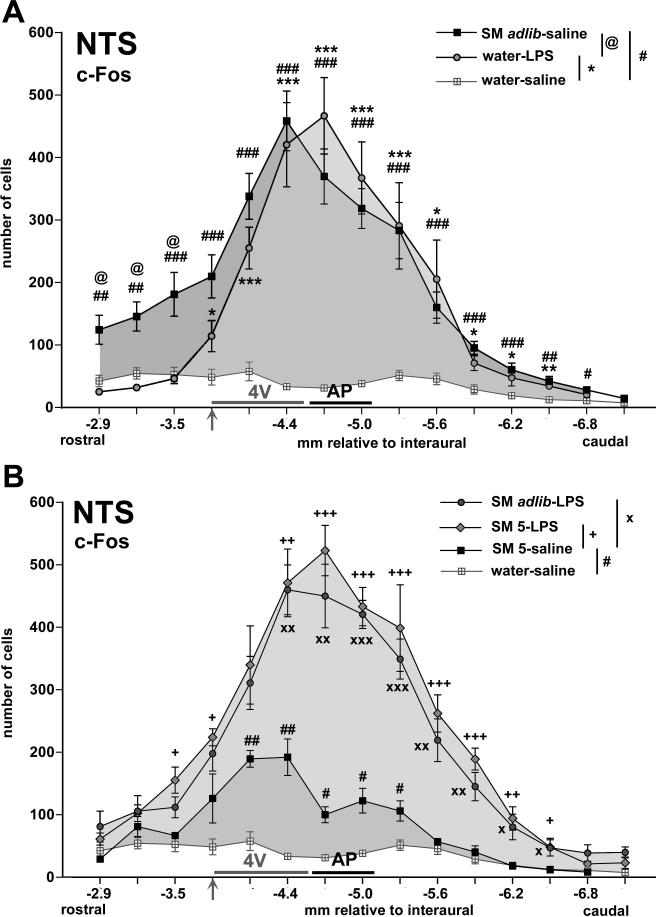
Fig. 2.
Graphs summarizing the rostrocaudal distribution of c-Fos-positive cells in the NTS, displaying group means (+/− SEM) of the cell counts in sections corresponding with atlas coordinates −2.9 mm to −7.1 mm relative to interaural with 0.3 mm increments. The grey horizontal bar along the X-axis levels indicates where the NTS abuts the floor of the fourth ventricle (4V) with the arrow indicating where the NTS recedes from the 4V. Caudally, the black horizontal bar indicates the level of the area postrema (AP). Panel A depicts the sweetened milk (ad libitum)-saline and water-LPS groups (with the water-saline group as reference) for comparison between the two different stimuli. # p < 0.05, ## p < 0.005, ### p < 0.0005: sweetened milk ad lib-saline vs. water-saline; * p < 0.05, ** p < 0.005, *** p < 0.0005: water-LPS vs. water-saline; @ p < 0.01: sweetened milk ad lib-saline vs. water-LPS. Panel B depicts the LPS-treated groups that had access to ad libitum sweetened milk (SM adlib) and to 5.0 ml milk (SM 5) for comparison with the saline-treated group that were offered 5.0 ml sweetened milk solution. These three groups consumed comparable non-satiating amounts. # p < 0.05, ## p < 0.005: sweetened milk 5 ml [SM 5]-saline vs. water-saline; + p < 0.05, ++ p < 0.005, +++ p < 0.0005: SM 5-LPS vs. SM 5-saline; x p < 0.05, xx p < 0.005, xxx p < 0.0005: sweetened milk ad lib-LPS vs. SM 5-saline.

