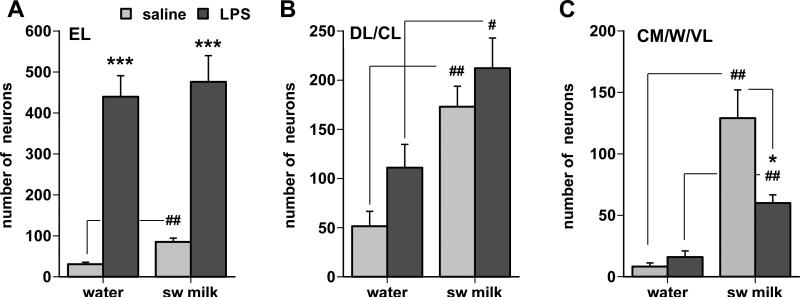
Fig. 9.
Bar graphs summarizing the effects of sweetened milk consumption and of LPS challenge on the number of c-Fos cells (group mean +/− SEM) in different subnuclei of the parabrachial nucleus, the external lateral (EL in A), the dorsal-lateral and central lateral (DL/CL in B), and the central medial, waist, and ventral lateral regions (CM/W/VL in C). * p < 0.05, *** p < 0.0001, saline vs. LPS treatment; # p < 0.05, ## p < 0.005, water vs. sweetened milk.

