
Fig. 2.
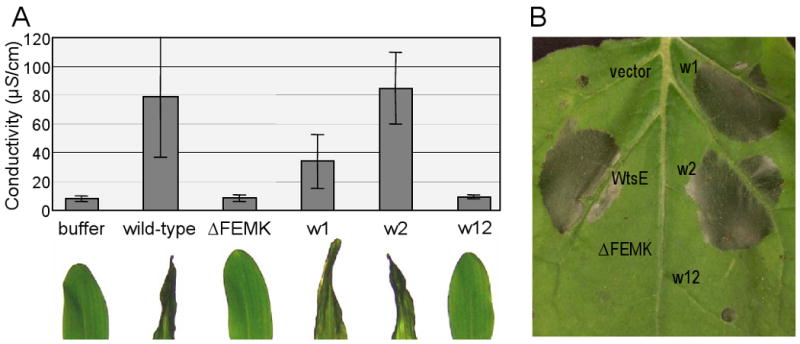
Cell death phenotypes induced by delivery of WtsE from E. coli into host and nonhost plants. A, photographs of corn seedling leaves (below) and corresponding ion leakage data (above) following infiltration with E. coli MC4100 (pCPP2156) strains delivering wild-type WtsE or the indicated derivatives. Each WtsE plasmid also encodes the chaperone WtsF. Conductivity values are means ± SD for three replications. B, photograph of the HR in N. benthamiana following delivery of WtsE or the indicated derivatives from E. coli. Photographs were taken at 15-18 h after infiltration and conductivity assays were done at 18 h after infiltration. Results are representative of three independent experiments