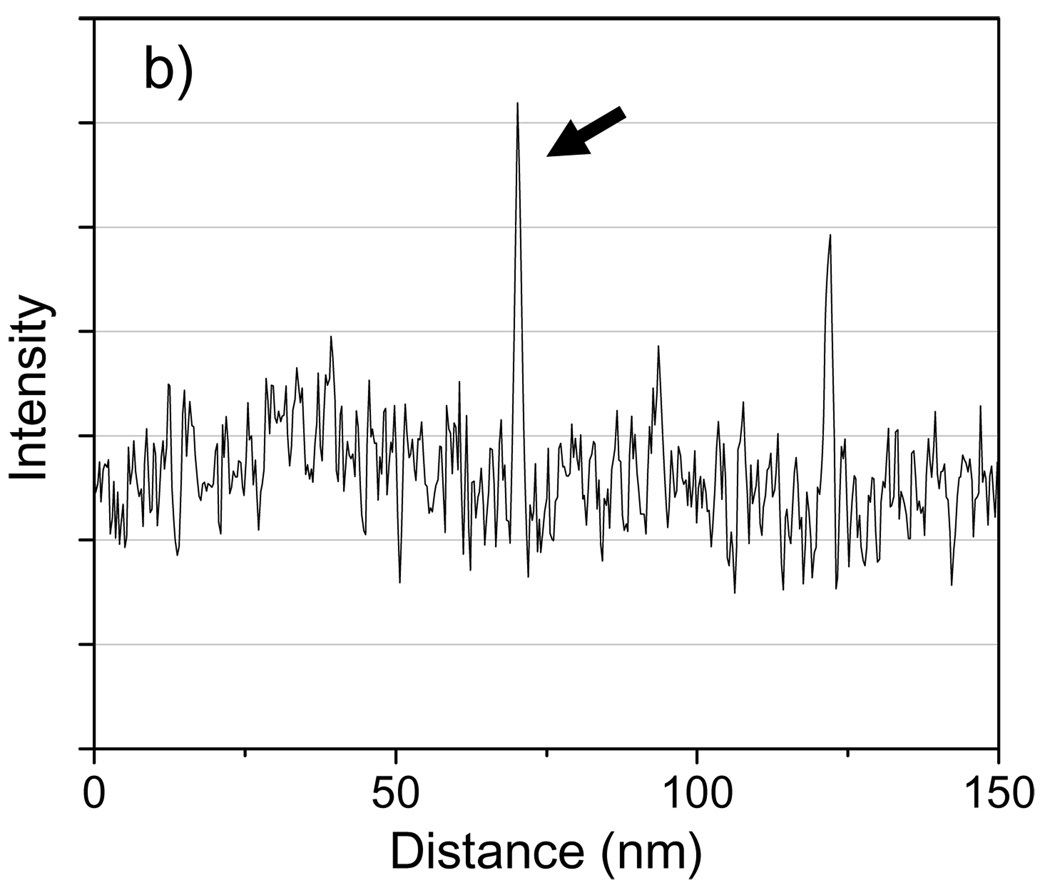
Fig. 18.
(a) Line profile across the dashed line in Fig. 17(b). The slice in Fig. 17b is from a tomogram binned by 3×3 pixels, but the line profile shown here was obtained from an unbinned tomogram. The numbered arrows correspond to the numbered features in Fig. 17(b) that are associated with the mitochondrial membranes. (b) 3-pixel wide line profile across the Nanogold cluster indicated between arrows in Fig. 17(c). The signal from this Nanogold cluster is significantly higher that that obtained from structures within the mitochondrion.


