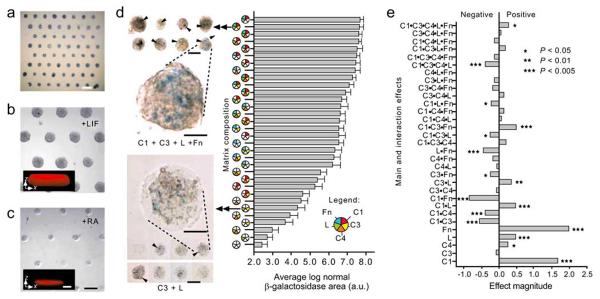
Fig. (2).
Mouse ES cells differentiate on ECM microarrays. (a) Bright-field alkaline phosphatase staining of day 1 ES cultures on ECM microarrays in 15% serum medium (scale bar, 1 mm). (b, c) Phase-contrast images of day 3 arrays cultured with LIF (b) and with RA (c). Cells cultured with LIF showed three-dimensional features (in b, inset x-z confocal section, ~77 μm thickness). In contrast, RA-induced cells grew as a relatively thin sheet (in c, inset x-z section, ~25 μm thickness). Scale bars, 250 μm (insert scale bars, 50 μm). (d) Bright-field micro-graph of selected X-gal stained ECM microarray conditions after 3 d of culture in RA. C1 + C3 + L +Fn (top left images) induced higher Ankrd17 reporter activity (arrowheads) than was seen in cells cultured on C3+L (bottom left images). Scale bars, 250 μm. Magnified views of reporter activity: scale bars, 50 μm. Bar graph: hierarchical depiction of ‘blue’ image area (pooled data from four microarrays) for each of the matrix mixtures. Error bars, s.e.m. (n=32). The C1 + C3 + L + Fn culture condition induced ~27-fold more β-galactosidase image area than the C3 + L cultures. (e) Results of 25 full factorial analysis on β-galactosidase positive ‘blue’ image area (four microarray data sets). The relative magnitude of main effects as well as 2-, 3-, 4- and 5-factor interactions are shown. C1, collagen I; C3, collagen III; C4, collagen IV; L, Laminin; Fn, fibronectin. (Figure from reference [36] with permission).

