
Figure 3.
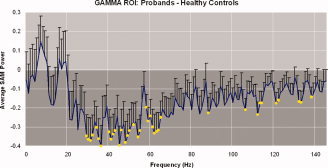
The standard of error of the difference in the 42‐voxel gamma ROI between healthy controls and schizophrenic patients is shown across a spectrum of frequencies. Yellow circles represent frequency windows with significant differences and the darkened background represents negative differences of the average SAM power (bandwidths in which healthy controls showed more SAM power than patients). The majority of significant bandwidth windows occurred between about 30 Hz and 70 Hz; however, scattered significant frequencies occurred in higher bandwidths as well. The interruption of significance‐representing yellow circles in the spike around 60 Hz can be attributed to powerline filtration.