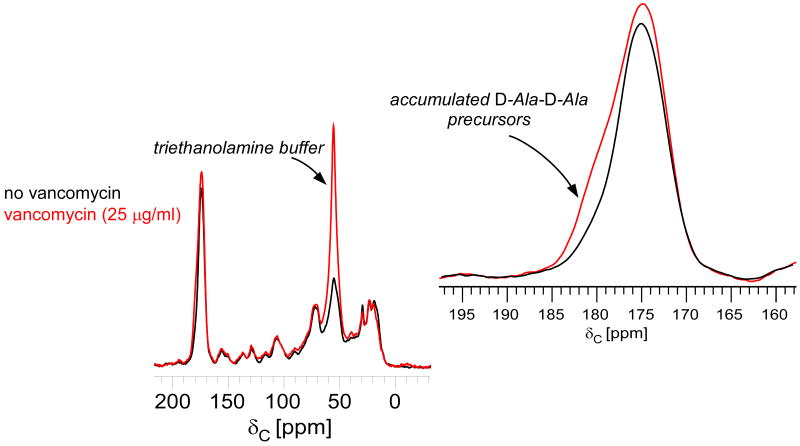
Figure 1.
13C CPMAS echo spectra of E. faecium whole cells enriched with D-[1-13C]alanine, grown in the presence of alaphosphin and no vancomycin (black) or 25 μg/ml vancomycin (red). The spectra are normalized with respect to the natural-abundance, aliphatic-carbon signal intensities between 0 and 35 ppm. The line shape of the peak centered around 175 ppm changes with the addition of vancomycin (inset). The D-Ala contribution at 178 ppm, whose signal results from a terminal carboxyl D-Ala, increases with vancomycin exposure as transglycosylase is inhibited and Park's nucleotide accumulates in the cytoplasm.

