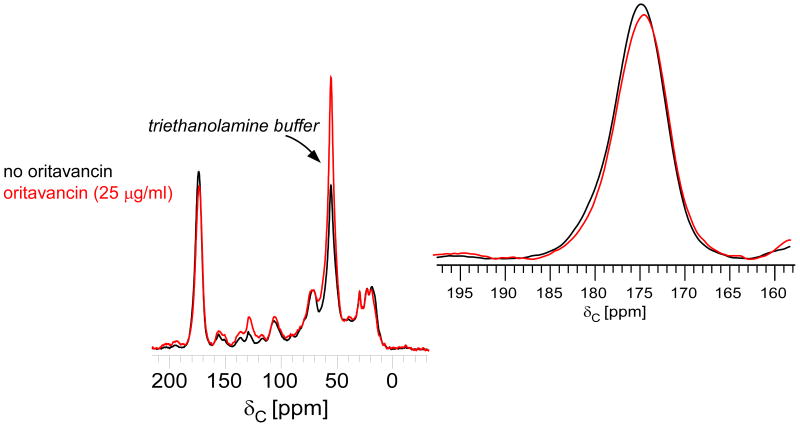
Figure 5.
13C CPMAS echo spectra of E. faecium whole cells enriched with D-[1-13C]alanine, grown in the presence of alaphosphin and no oritavancin (black) or 25 μg/ml oritavancin (red). The spectra are normalized with respect to the natural-abundance, aliphatic-carbon signal intensities between 0 and 35 ppm. The line shape of the peak centered around 175 ppm does not change significantly with the addition of oritavancin (inset). The absence of increased signal at 178 ppm corresponding to cytoplasmic cell-wall precursors, as observed for cells treated with vancomycin (see Figure 1), shows that oritavancin does not significantly affect transglycosylase.

