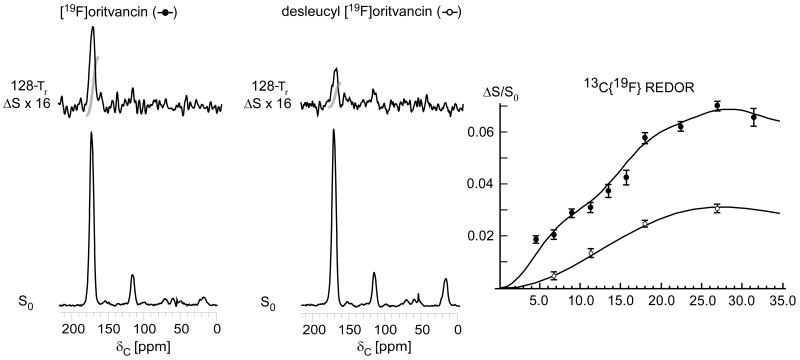
Figure 9.
125-MHz 13C{19F} REDOR spectra after 128-Tr evolution for E. faecium whole cells enriched with L-[1-13C]lysine and complexed with either [19F]oritavancin (left) or desleucyl [19F]oritavancin (middle). The REDOR difference for desleucyl [19F]oritavancin shows binding to E. faecium peptidoglycan despite the drug's damaged D-Ala-D-Ala binding pocket. (Right) 13C{19F} REDOR dephasing (ΔS/S0) of the 175-ppm peak as a function of dipolar evolution time. The data were normalized to the concentration of peptidoglycan stems. The [19F]oritavancin dephasing data (solid circles) were fit to 5.1 and 7.8-Å distances with 2 and 5% dephasing maxima, respectively. The desleucyl [19F]oritavancin data (open circles) were fit to one distance of 7.8 Å with a 3% dephasing maximum. The spectra on the left resulted from the accumulation of 16,000 scans, and those in the middle from 106,000 scans. Error bars based on integrals were determined by uncertainties in ΔS.

