
Fig. 3.
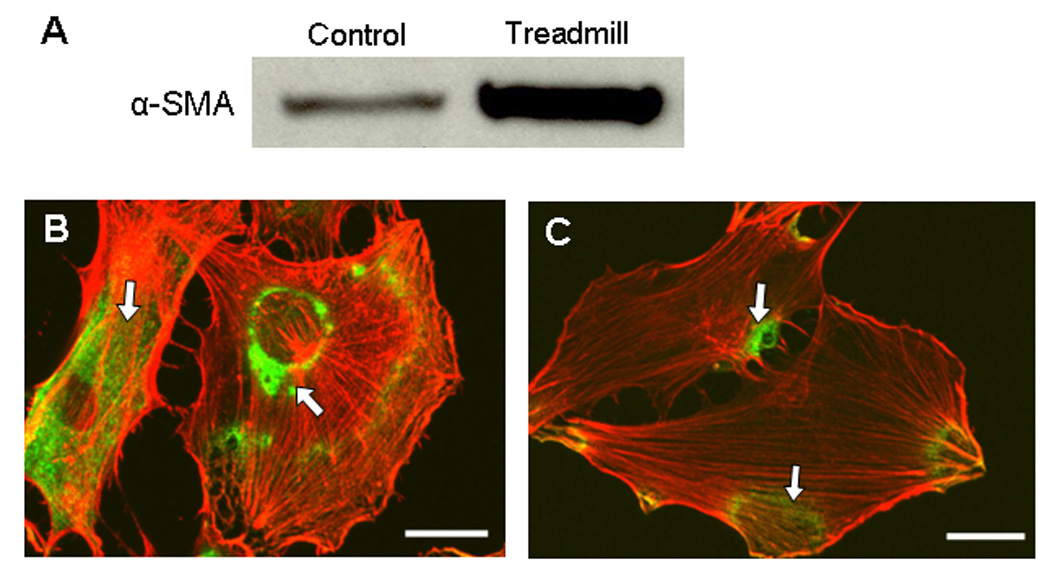
Western blot analysis of α-SMA expression in MPTCs from treadmill running and control mice (A). MPTCs from treadmill running mice had much higher levels of α-SMA expression compared to those cells from cage control mice. Immunocytochemistry for α-SMA (green) and actin filaments (red) of MPTCs from treadmill running mouse (B) and control mouse (C). More a-SMA green signals (arrows) were seen in MPTCs from treadmill running mice than in cells from cage control mice. (Scale bars: 20 µm.)