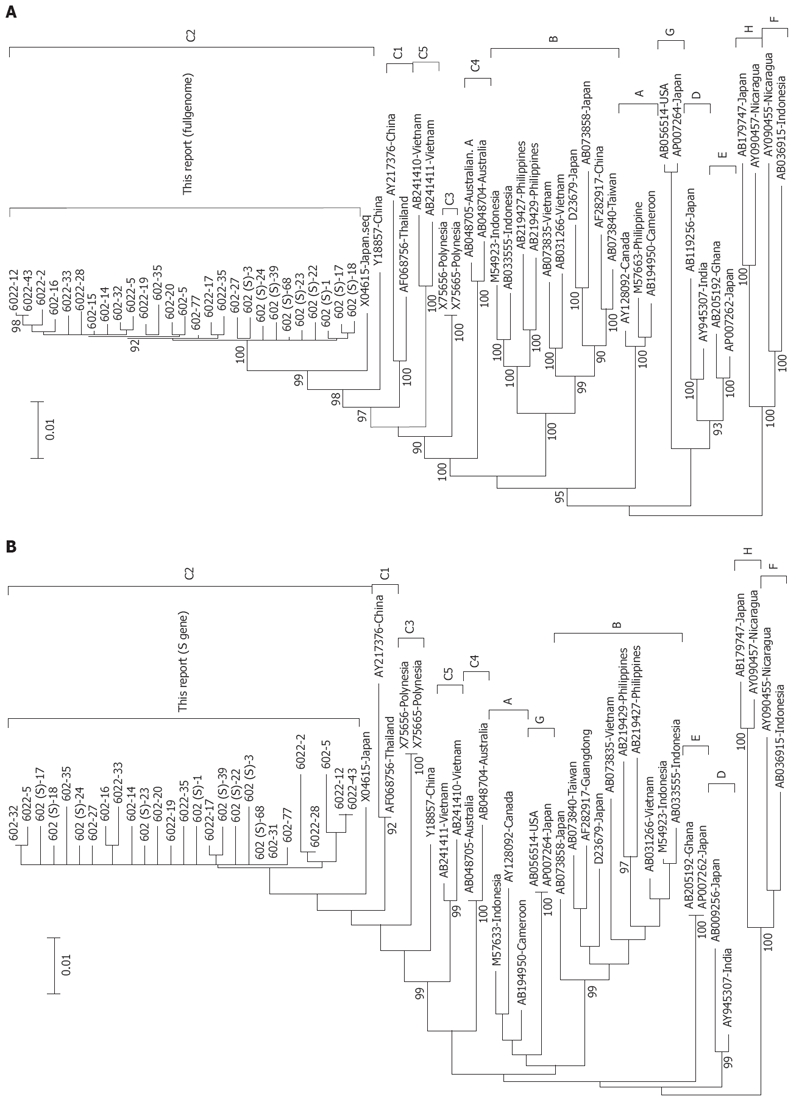
Figure 1.

Phylogenetic tree constructed on the complete genome (A) and S gene (B) [Mother: 602 (1 d), 6022 (6 mo); Son: 602 (S)]. Bootstrap values are shown at the beginning of each main node. The length of the horizontal bar indicates the number of nucleotide substitutions per site. The origin of each strain has also been shown.
