
Figure 1.
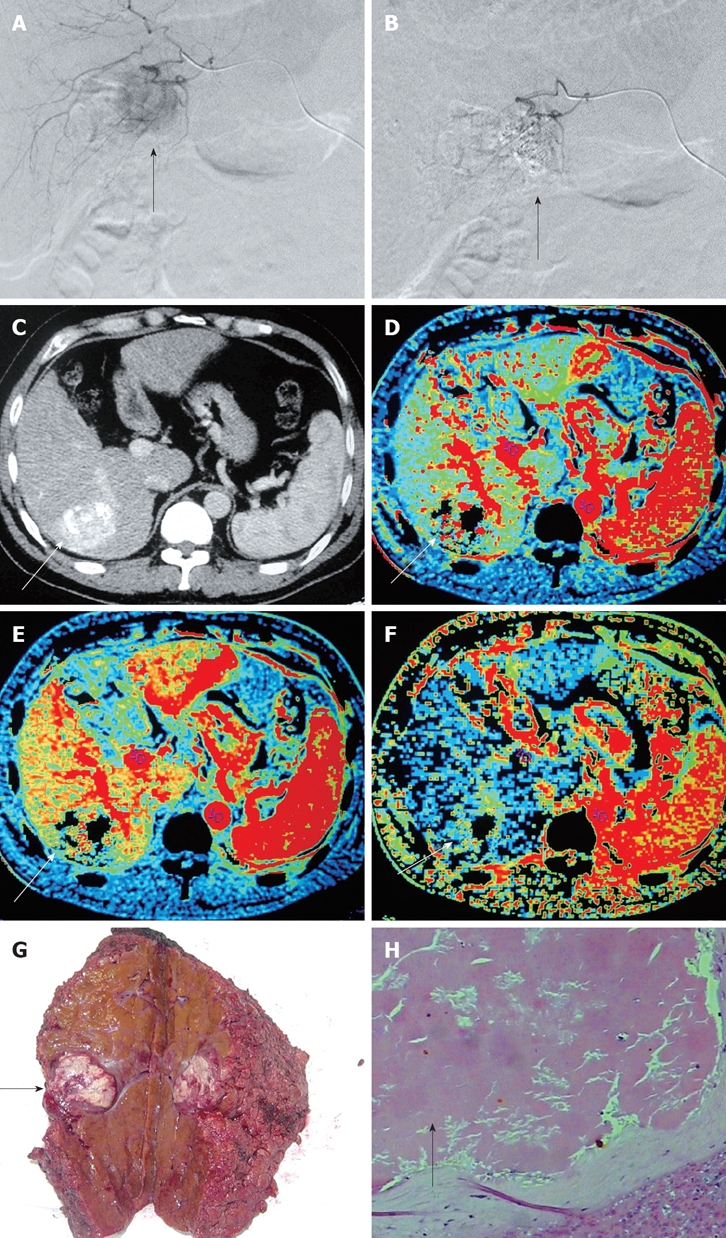
Images obtained in a patient with HCC verified with treatment response of PR. A: Pre-TACE angiography showing a tumor with a diameter of 3.5 cm in the right lobe of liver (arrow); B: Post-TACE angiography showing a viable region of tumor that was reduced by more than 50% (arrow) compared with pre-TACE; C: CT image 4 wk after TACE showing an incomplete lipiodol accumulation in the viable tumor region (arrow); D: HBF map of post-TACE CT perfusion showing a significant decrease of HBF in the viable tumor (arrow) compared with pre-TACE; E: Post-TACE HBV map showing a significant decrease of HBV in the viable tumor (arrow) compared with pre-TACE; F: Post-TACE HAF map showing a significant decrease of HAF in the viable tumor (arrow); G: Small necrotic lesions observed (arrow) after two periods of TACE treatment (arrow); H: Pathological slides (HE staining, × 40) showing lipiodol embolism in the small vascular cavity (arrow).