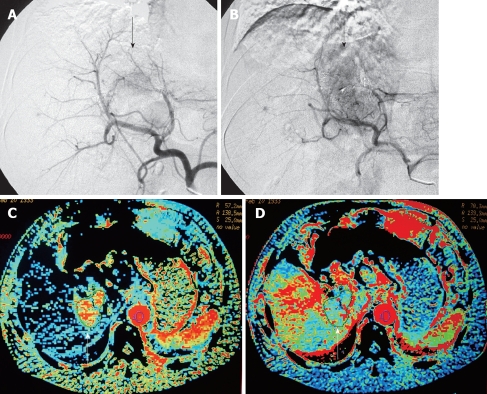
Figure 2.
Images obtained from a patient with HCC with treatment respo-nse of PD group. A: Pre-TACE angiography showing a tumor in the left lobe of liver (arrow); B: Post-TACE angiography showing an increased viable tumor region by more than 25% (arrow) compared with pre-TACE; C: HAF map of post-TACE CT perfusion showing significantly increased HAF in the viable tumor (arrow) compared with pre-TACE; D: Post-TACE HBF map showing increased HBF in the viable tumor (arrow) compared with pre-TACE.

