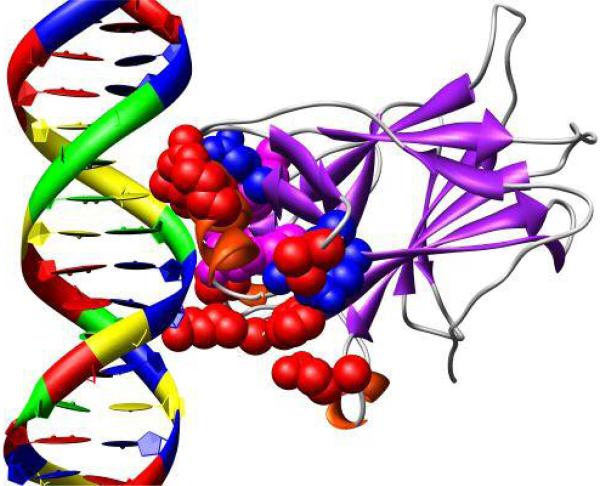
Fig. 12.
Residues selected by mutual information value. Residues selected for just their electrostatic components appear in red, steric features appear in blue and both steric and electrostatic features appear in magenta. The DNA binding region is frequently selectecd and therefore inferred to be important. Some less frequently selected residues cluster around residue Y103 on the other side of the protein (data not shown).

