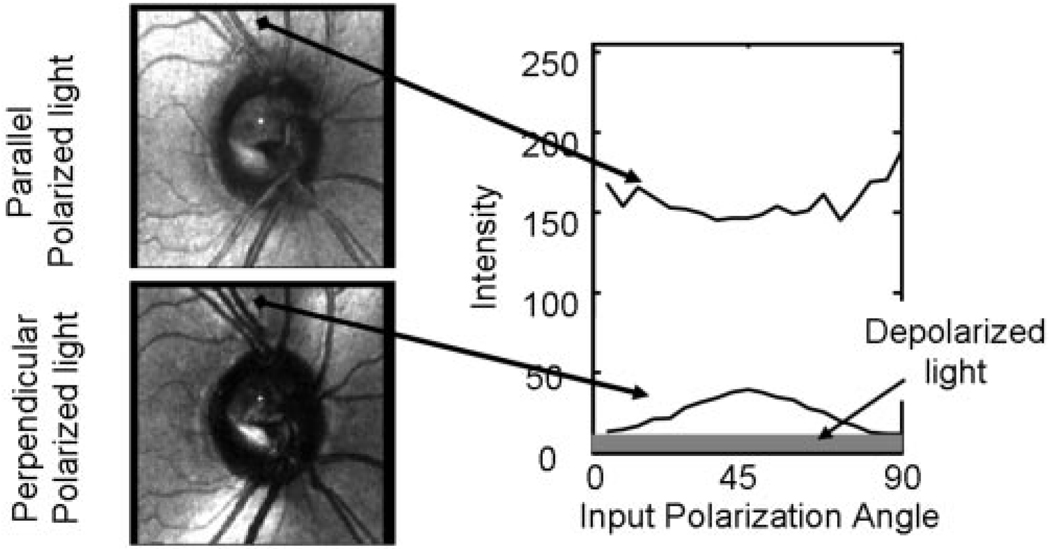
Figure 2.
Schematic diagram of the algorithm for computation of depolarized image. Two raw images from the patient in Figure 2, for the parallel detector (top) and the crossed polarized detector (bottom), showing the location of a region of interest. Intensity within the region of interest as a function of the input polarization.

