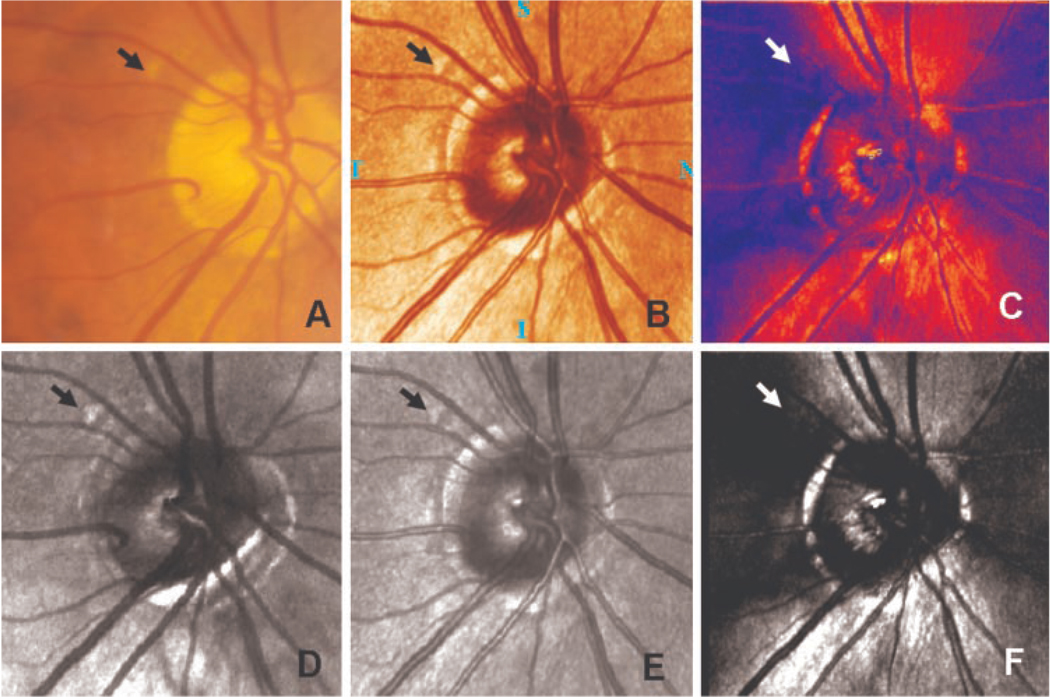
Figure 3.
A comparison of retinal images of a patient in the study. The druse in each image is indicated by an arrow. (A) Color fundus photograph. (B) A standard pseudocolor image of the retina from the standard GDx analysis. (C) The nerve fiber layer thickness map of the same region. (D) Depolarized light image. In addition to the druse, other nearby structures are evident. (E) Average grayscale image. (F) Polarization modulation image. Note that images (B) and (E), and (C) and (F), are essentially the same information, but the top row contains two images computed by the GDx software, and the bottom row shows the corresponding images computed with our analysis routines.

