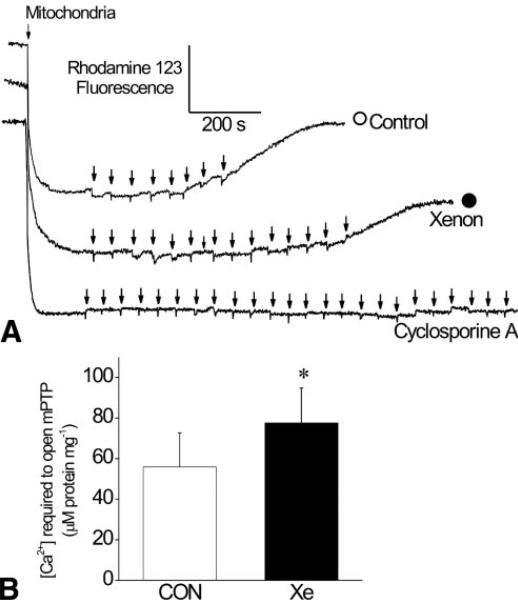
Figure 4.
Effect of xenon preconditioning on isolated mitochondrial permeability transition pore (mPTP) opening. A typical chart recording showing mitochondrial membrane potential at state 2 with increasing calcium concentration ([Ca2+]) is illustrated in Panel A. The arrows denote the addition of Ca2+ in 5 μM increments. Depolarization was detectable by opening mPTP and releasing Ca2+ from mitochondrial through the mPTP with sequential Ca2+ loading. Xenon preconditioning delayed depolarization, indicating inhibition of mPTP opening. Open circle = control; Solid circle = xenon preconditioning. Depolarization was not observed in the presence of mPTP inhibitor cyclosporine A. Histograms summarizing the results are depicted in Panel B. CON = control; Xe = xenon preconditioning (n = 6 per group). Values are mean ± sd. *Significantly (P < 0.05) different from CON.

