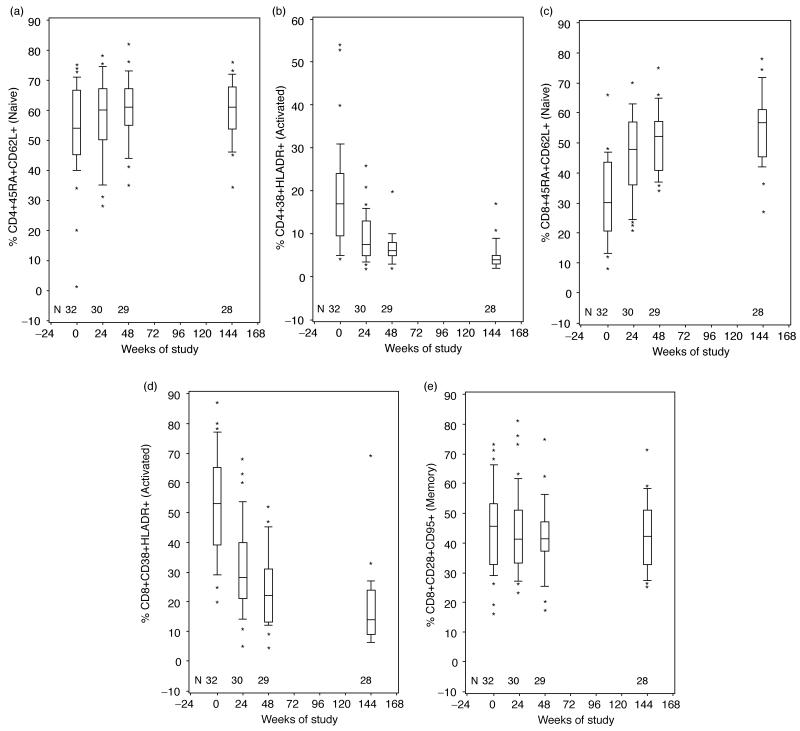
Fig. 2. Kinetics of lymphocyte subpopulations in HIV-infected children receiving their first HAART regimen.
Boxes represent upper and lower quartiles with the median as an internal line; whiskers show 95% upper and lower boundaries; and asterisks indicate outliers. N indicates the number of patients contributing data at each time point. (a) Naive CD4+CD45RA+CD62L+%; (b) activated CD4+CD38+HLADR+%; (c) naive CD8+CD45RA+CD62L+%; (d) activated CD8+CD38+HLADR %; (e) memory CD4+CD28+CD95+% over time of HAART.

