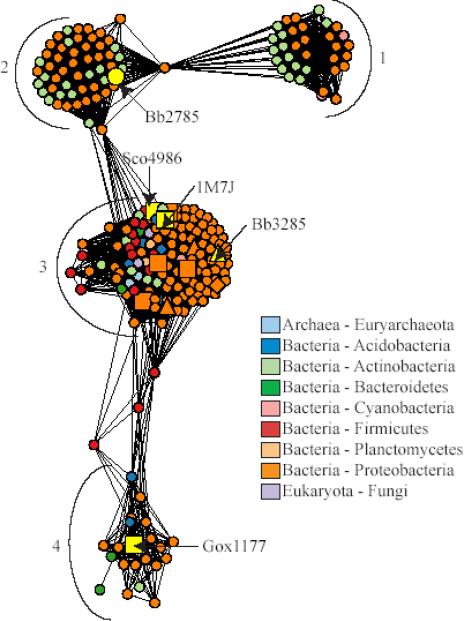
Figure 10.
Network representation of the sequence relationships in the N-acyl-d-amino-acid deacylase like sequence group. Each node in the network represents a single sequence and each edge represents the pairwise connection between two sequences with the most significant BLAST E-value (better than 1*10−45). Lengths of edges (depicted as lines) are not meaningful except that sequences in tightly clustered groups are relatively more similar to each other than sequences with few connections. Sequences that have been experimentally characterized are represented as follows: squares, N-acyl-d-amino-acid deacylases generally preferring uncharged substrates; triangles, N-acyl-d-glutamate deacylases; diamonds, N-acyl-d-aspartate deacylases. Sequences are colored according to phylum, except for 1M7J and those for the proteins whose substrate specificities were investigated in this work, which are labeled and colored yellow. The major clusters discussed in the text are indicated with numbers.

