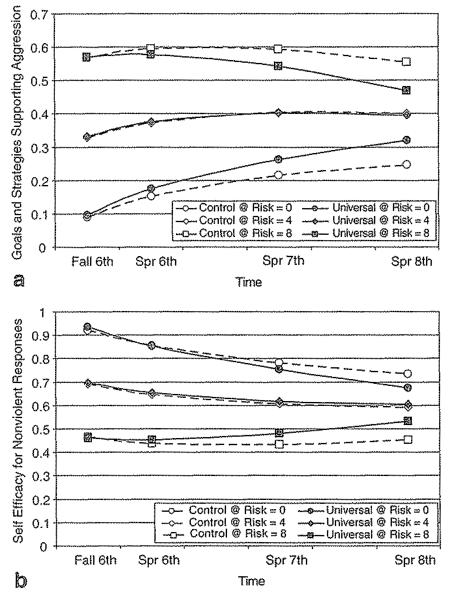
Fig. 2.
Growth trajectories for students at universal and control schools as a function of the number of risk factors at pretest on a Goals and Strategies Supporting Aggression, and b Self-Efficacy for Nonviolent Responses. Plotted trajectories are based on linear and quadratic coefficients but do not include variation within school years (i.e., fall-to-spring changes). Intercepts within each level of the Risk Index were based on the average across intervention and control schools to facilitate comparisons

