Figure 5.

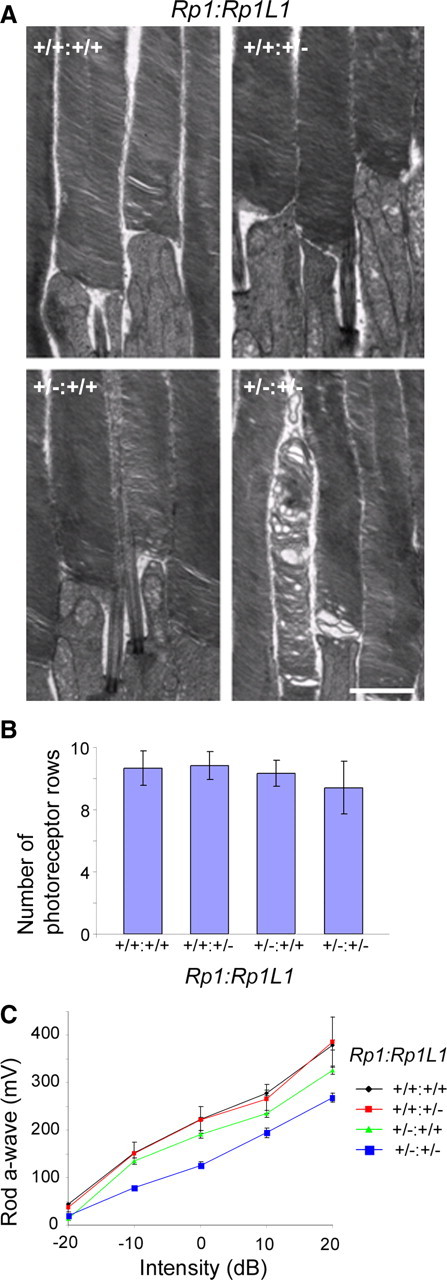
Genetic interactions of Rp1L1 and Rp1. A, Transmission electron microscopy of OSs of retinas of a double heterozygous mouse at 6 months and its wild-type littermate. Note the appearance of abnormal discs only in the double heterozygote. Scale bar, 2 μm. B, Average numbers of photoreceptor rows in ONL of central retinas at 6 months. Group mean values, SDs (bars), and numbers of mice examined in A and B in each genotype and age are shown. C, Amplitudes (in millivolts) of scotopic a-waves with increasing light intensities. A series of light intensities were used from −20 dB to +20 dB (i.e., −2 to 2 log cd · s · m−2) in steps of 1 log cd · s · m−2. ERG amplitudes were recorded from 20 mice at 6 months: 5 Rp1+/− (green), 3 Rp1L1+/− (red), 7 Rp1+/−:Rp1L1+/− (blue), and 5 wild-type (black) mice. Error bars give SEM.
