Figure 4.

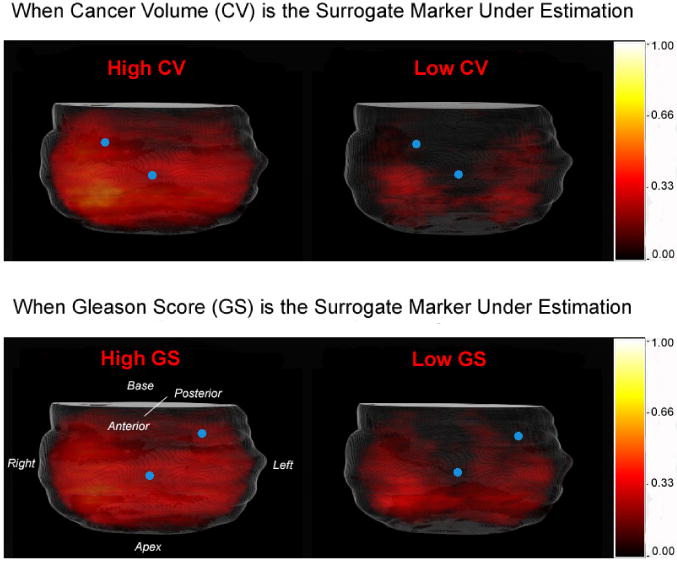
Statistical atlases constructed from subpopulations having different (high v.s. low) surrogate marker values. Blue dots represent intuitively-observed biopsy locations where different subpopulations can be differentiated.

Statistical atlases constructed from subpopulations having different (high v.s. low) surrogate marker values. Blue dots represent intuitively-observed biopsy locations where different subpopulations can be differentiated.