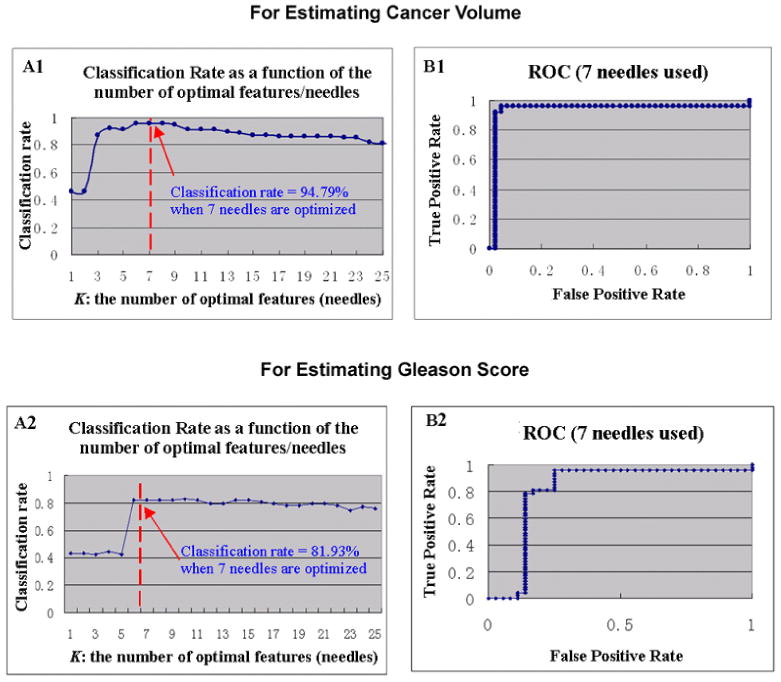
Figure 8.

Estimation accuracy for CV (top row) and GS (bottom row), by the optimized biopsy procedures in transperineal settings. (A1&A2): classification rate as a function of the number of optimal needles. (B1&B2): ROC curve, where 7 needles were used.
