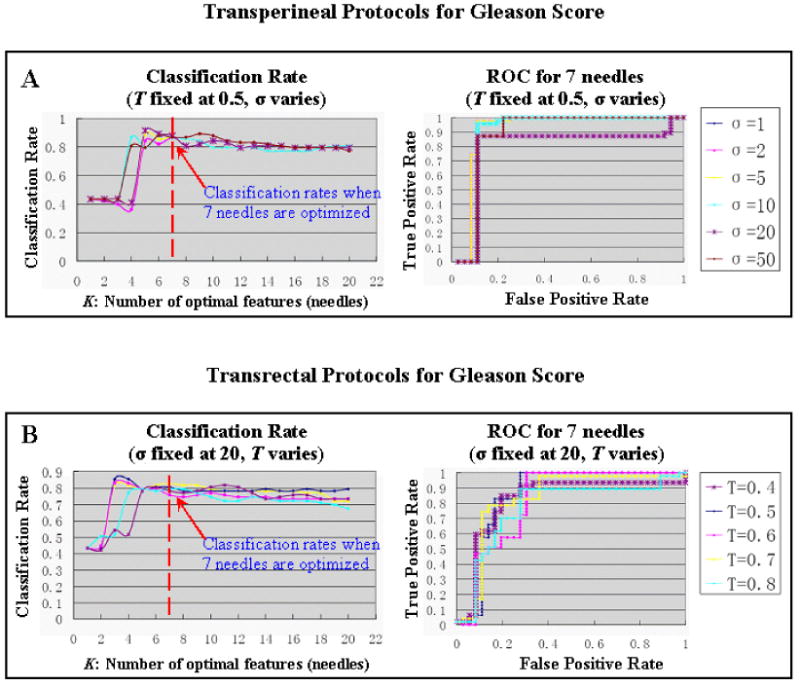
Figure 9.

Robustness of our approach in estimating GS, with regard to the variations of two major optimization parameters (threshold T and Gaussian kernel σ). (A) T is fixed at 0.5, and σ varies from 1 to 50 (transperineal setting); (B) σ is fixed at 20, and T varies from 0.4 to 0.8 (transrectal setting).
