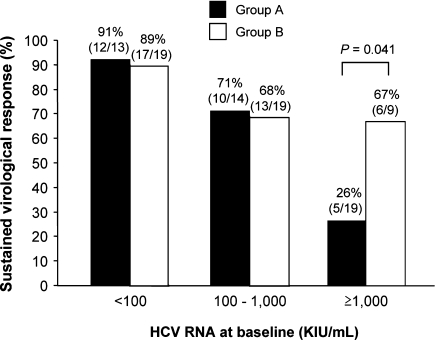
Fig. 3.
Sustained virological response (SVR) rates stratified according to pretreatment HCV RNA level for patients of groups A (24 weeks) and B (48 weeks) infected with HCV genotype 2. The SVR rate was significantly lower in patients with higher baseline viral load in group A (P < 0.001) but not in group B (P = 0.096). The SVR rate in patients with a baseline viral load of less than 1,000,000 IU/ml was similar between group A (81%, 22/27) and group B (79%, 30/38) (P = 0.801). However, the SVR rate in those with a baseline viral load of 1,000,000 IU/ml or higher was lower in group A (26%, 5/19) than in group B (67%, 6/9) (P = 0.041)

