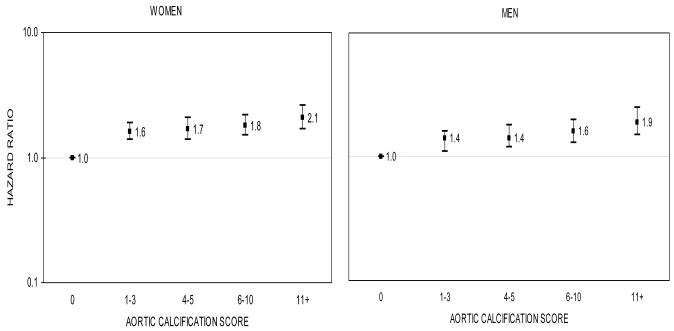
FIG. 4.
Multivariable-adjusted hazard ratios* for death in women (left) and men (right) according to aortic calcification score, The Framingham Study, 1967-70 through 2003
The y-axis is on a log scale. The reference group is aortic calcification score 0. The bars denote 95 percent confidence intervals.
* Models included baseline age, body mass index, systolic blood pressure, smoking, total cholesterol, diabetes, coronary heart disease, and estrogen use (in women).

