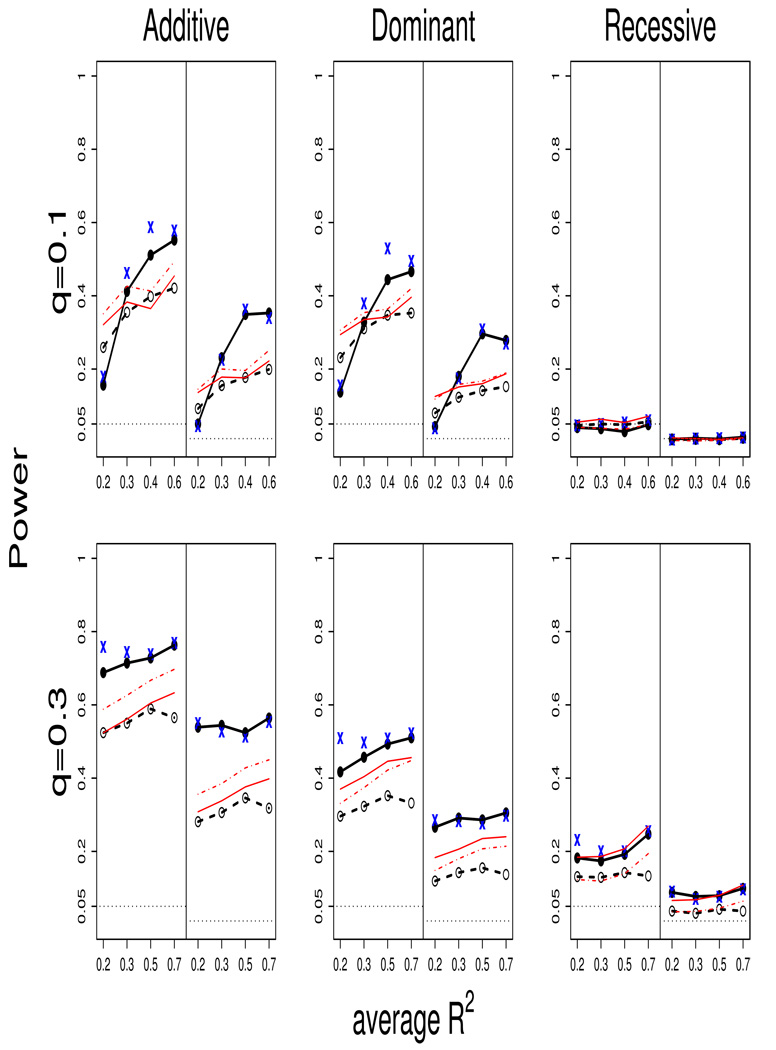
Figure 1.
Power comparisons for binary traits. The power are calculated based on 5,000 replications. In each plot, the left (right) panels are for nominal level 0.05 (0.01), and the horizontal dotted lines in the bottom indicates the corresponding nominal level. The upper (lower) panel is the results for allele frequency q = 0.1 (0.3). Lines with circles are results for haplotype-based analysis, and lines without circles are results for SNP-based analysis. Specifically, the solid lines with filled circles indicate the HS method, the dashed lines with open circles indicate the HAP method, the dotted-dashed lines indicate the SNP-1 method, and the solid lines indicate the SNP-2 method. The “x” signs indicate the VC method.

