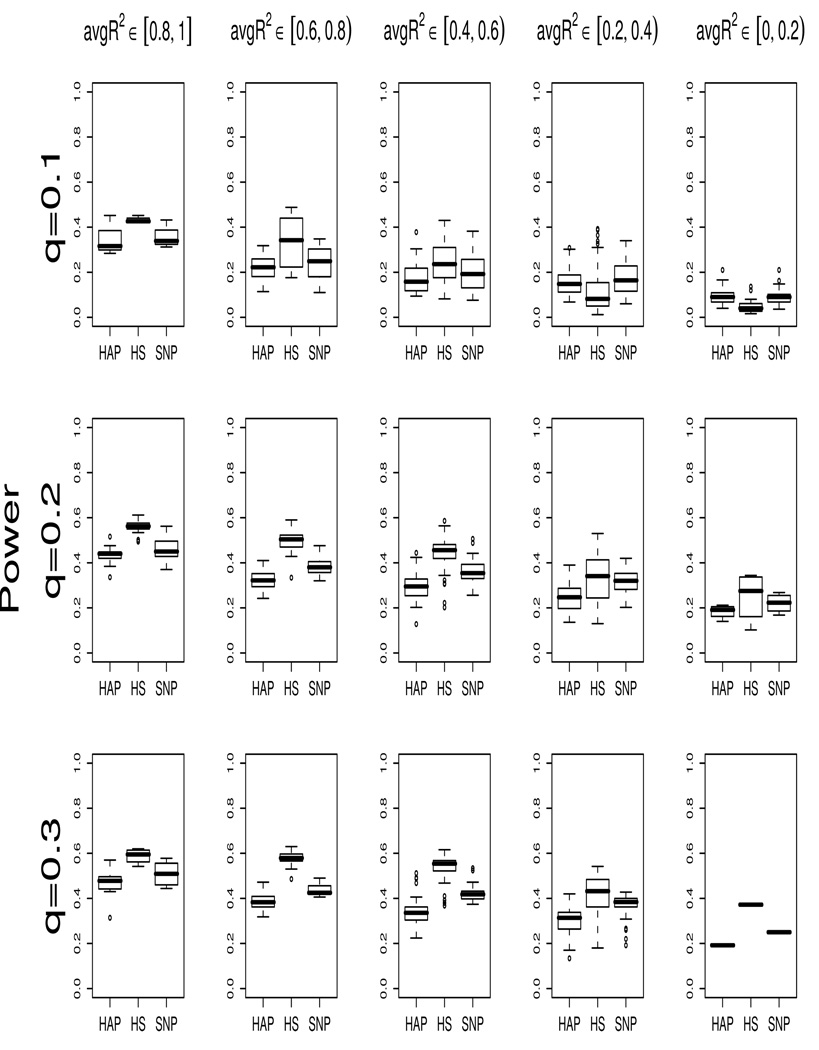
Figure 3.
Boxplots of power of the HAP/HS/SNP-1 methods for all simulated genome regions with max R2 > 0.7. The data consist of 100 cases and 100 control which were generated under an additive model. The power are evaluated based on 1,000 replications at nominal level 0.01. The upper/middle/lower panels are the results for allele frequency q ≈ 0.1/0.2/0.3, respectively.

