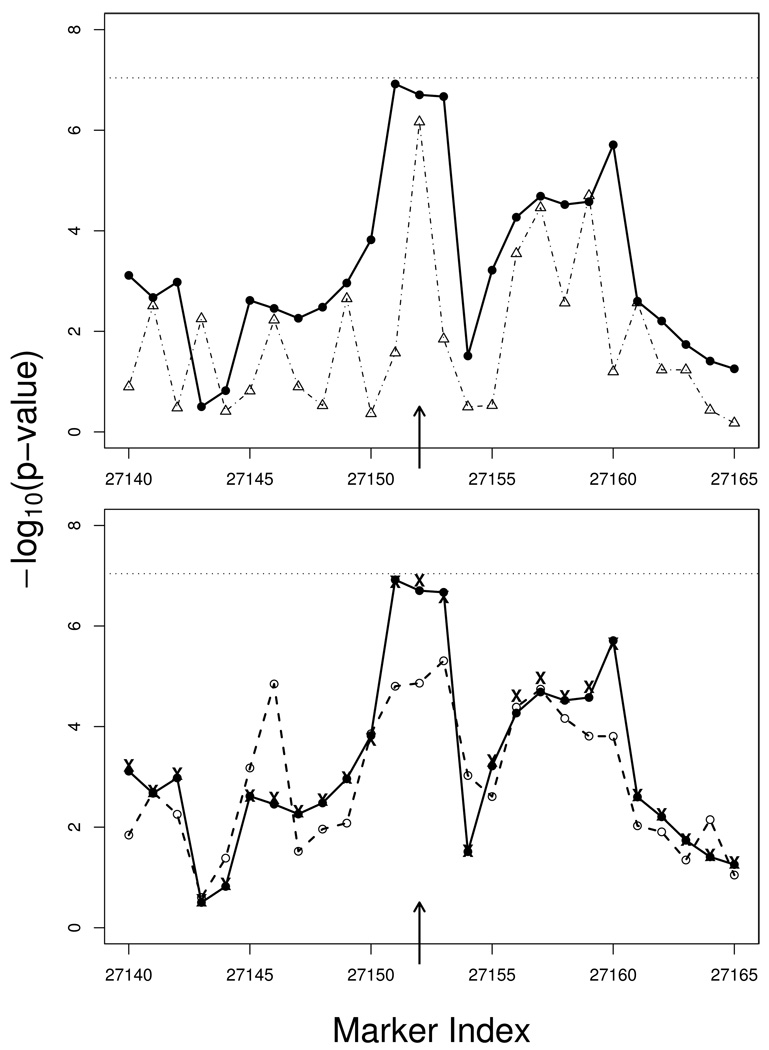
Figure 4.
P-values from the ALS data analysis around the most promising SNP reported in Schymick et al. (i.e., SNP rs4363506 with location indicated by the arrow). The p-values are presented on the scale of negative logarithm of base 10, and the horizontal lines indicate the Bonferroni genome-wide threshold. Upper panel: p-values of the HS method based on 3-SNP haplotypes (solid line with filled circle) vs. p-values of the SNP-2 method (dotted-dashed line with open triangle). Lower panel: p-values of the HS method (solid line with filled circle) vs. p-values of the HAP method (dashed line with open circle). The “x” signs indicate the p-values of the VC method.

